Table of Contents
HMS-I2 1μM R06 exp286
Mechanism of Action
putative HDAC inhibitor from cell-based screen
- Class / Subclass 1: Uncharacterized Mechanism / Chemical Screen Hit
Technical Notes
Protein References
- PubChem Name: N-(1-Benzothiophen-2-yl)-4-[(2-chloro-6-fluorophenyl)methyl]piperazine-1-carboxamide
- Synonyms: N/A
- CAS #: 690626-60-9
- PubChem CID: 2811440
- IUPAC: N-(1-benzothiophen-2-yl)-4-[(2-chloro-6-fluorophenyl)methyl]piperazine-1-carboxamide
- INCHI Name: InChI=1S/C20H19ClFN3OS/c21-16-5-3-6-17(22)15(16)13-24-8-10-25(11-9-24)20(26)23-19-12-14-4-1-2-7-18(14)27-19/h1-7,12H,8-11,13H2,(H,23,26)
- INCHI Key: BPEPKMJSLJPOFO-UHFFFAOYSA-N
- Molecular Weight: 403.9
- Canonical SMILES: C1CN(CCN1CC2=C(C=CC=C2Cl)F)C(=O)NC3=CC4=CC=CC=C4S3
- Isomeric SMILES: N/A
- Molecular Formula: C20H19ClFN3OS

Protein Supplier
- Supplier Name: MayBridge
- Catalog #: HTS 03843
- Lot #: N/A
Protein Characterization
- HRMS (ESI-TOF) m/z: (M+H)+ Calcd for C20H19ClFN3OS 404.09942; found 404.10247
Dose Response Curve
Dose response curve not available.
Screen Summary
- Round: 06
- Dose: 1µM
- Days of incubation: 8
- Doublings: 7.9
- Numbers of reads: 9120649
Screen Results
| Sensitive/Resistant hits (FDR<0.05) | CRANKS | Score Plot | Top 30 Genes | Screen Similarity | Top 30 Sensitive GO terms | Top 30 Resistant GO terms |
|---|---|---|---|---|---|---|
| 2/0 | Scores |
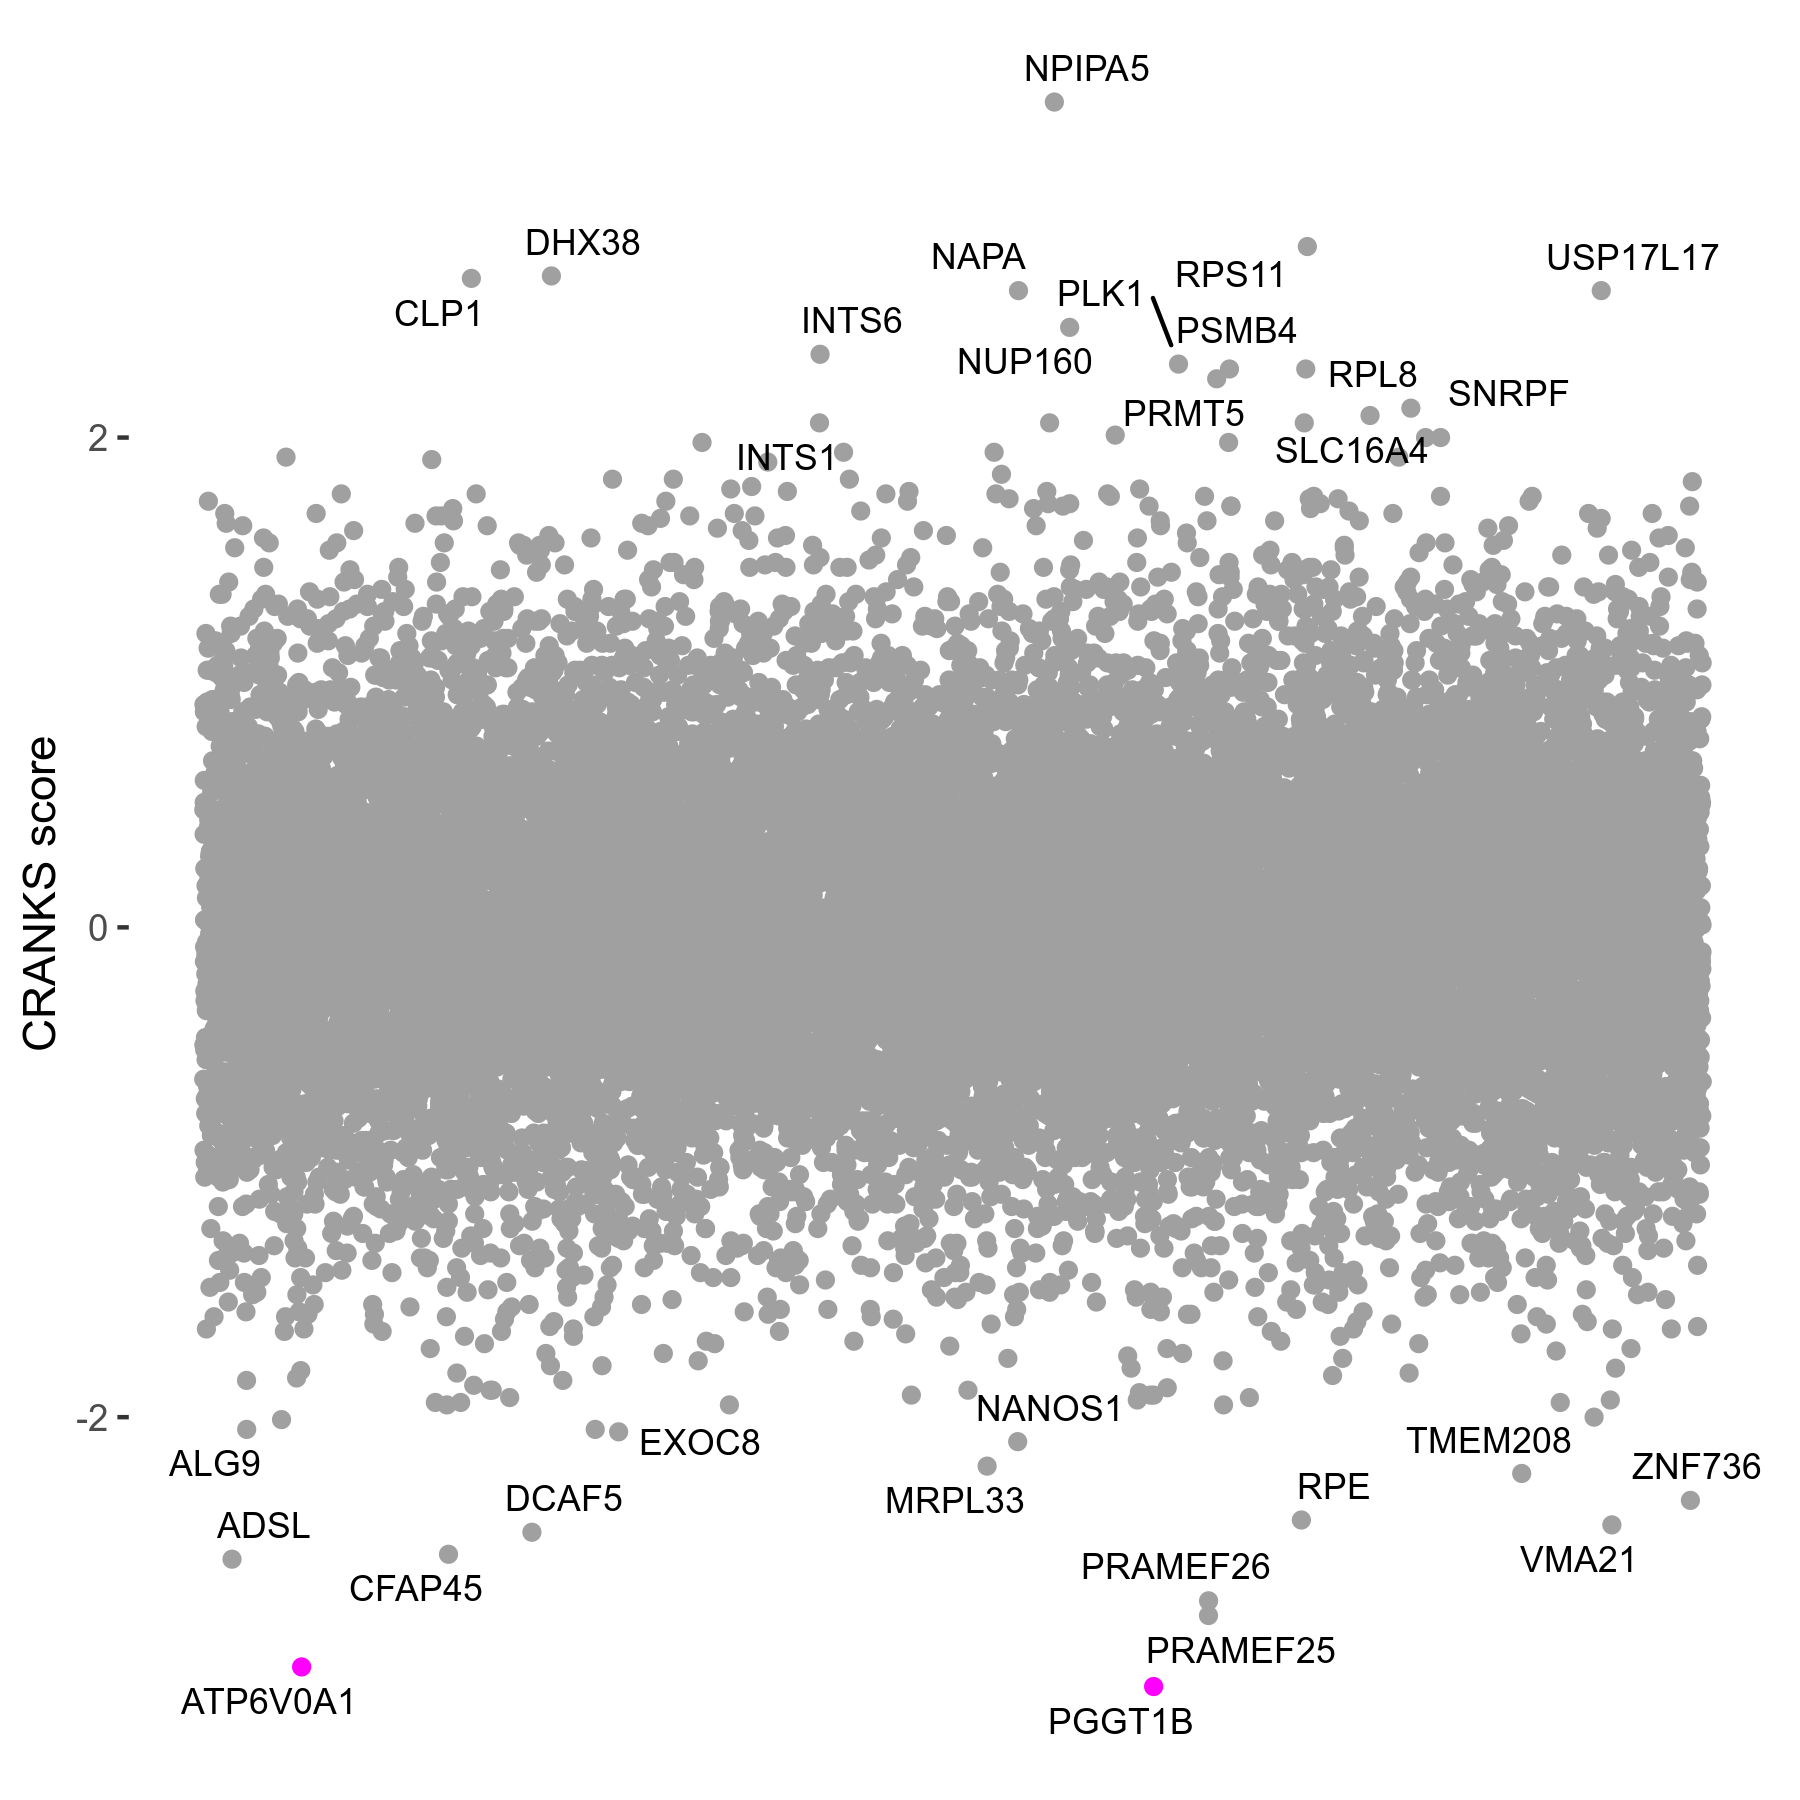
HMS-I2 1μM R06 exp286
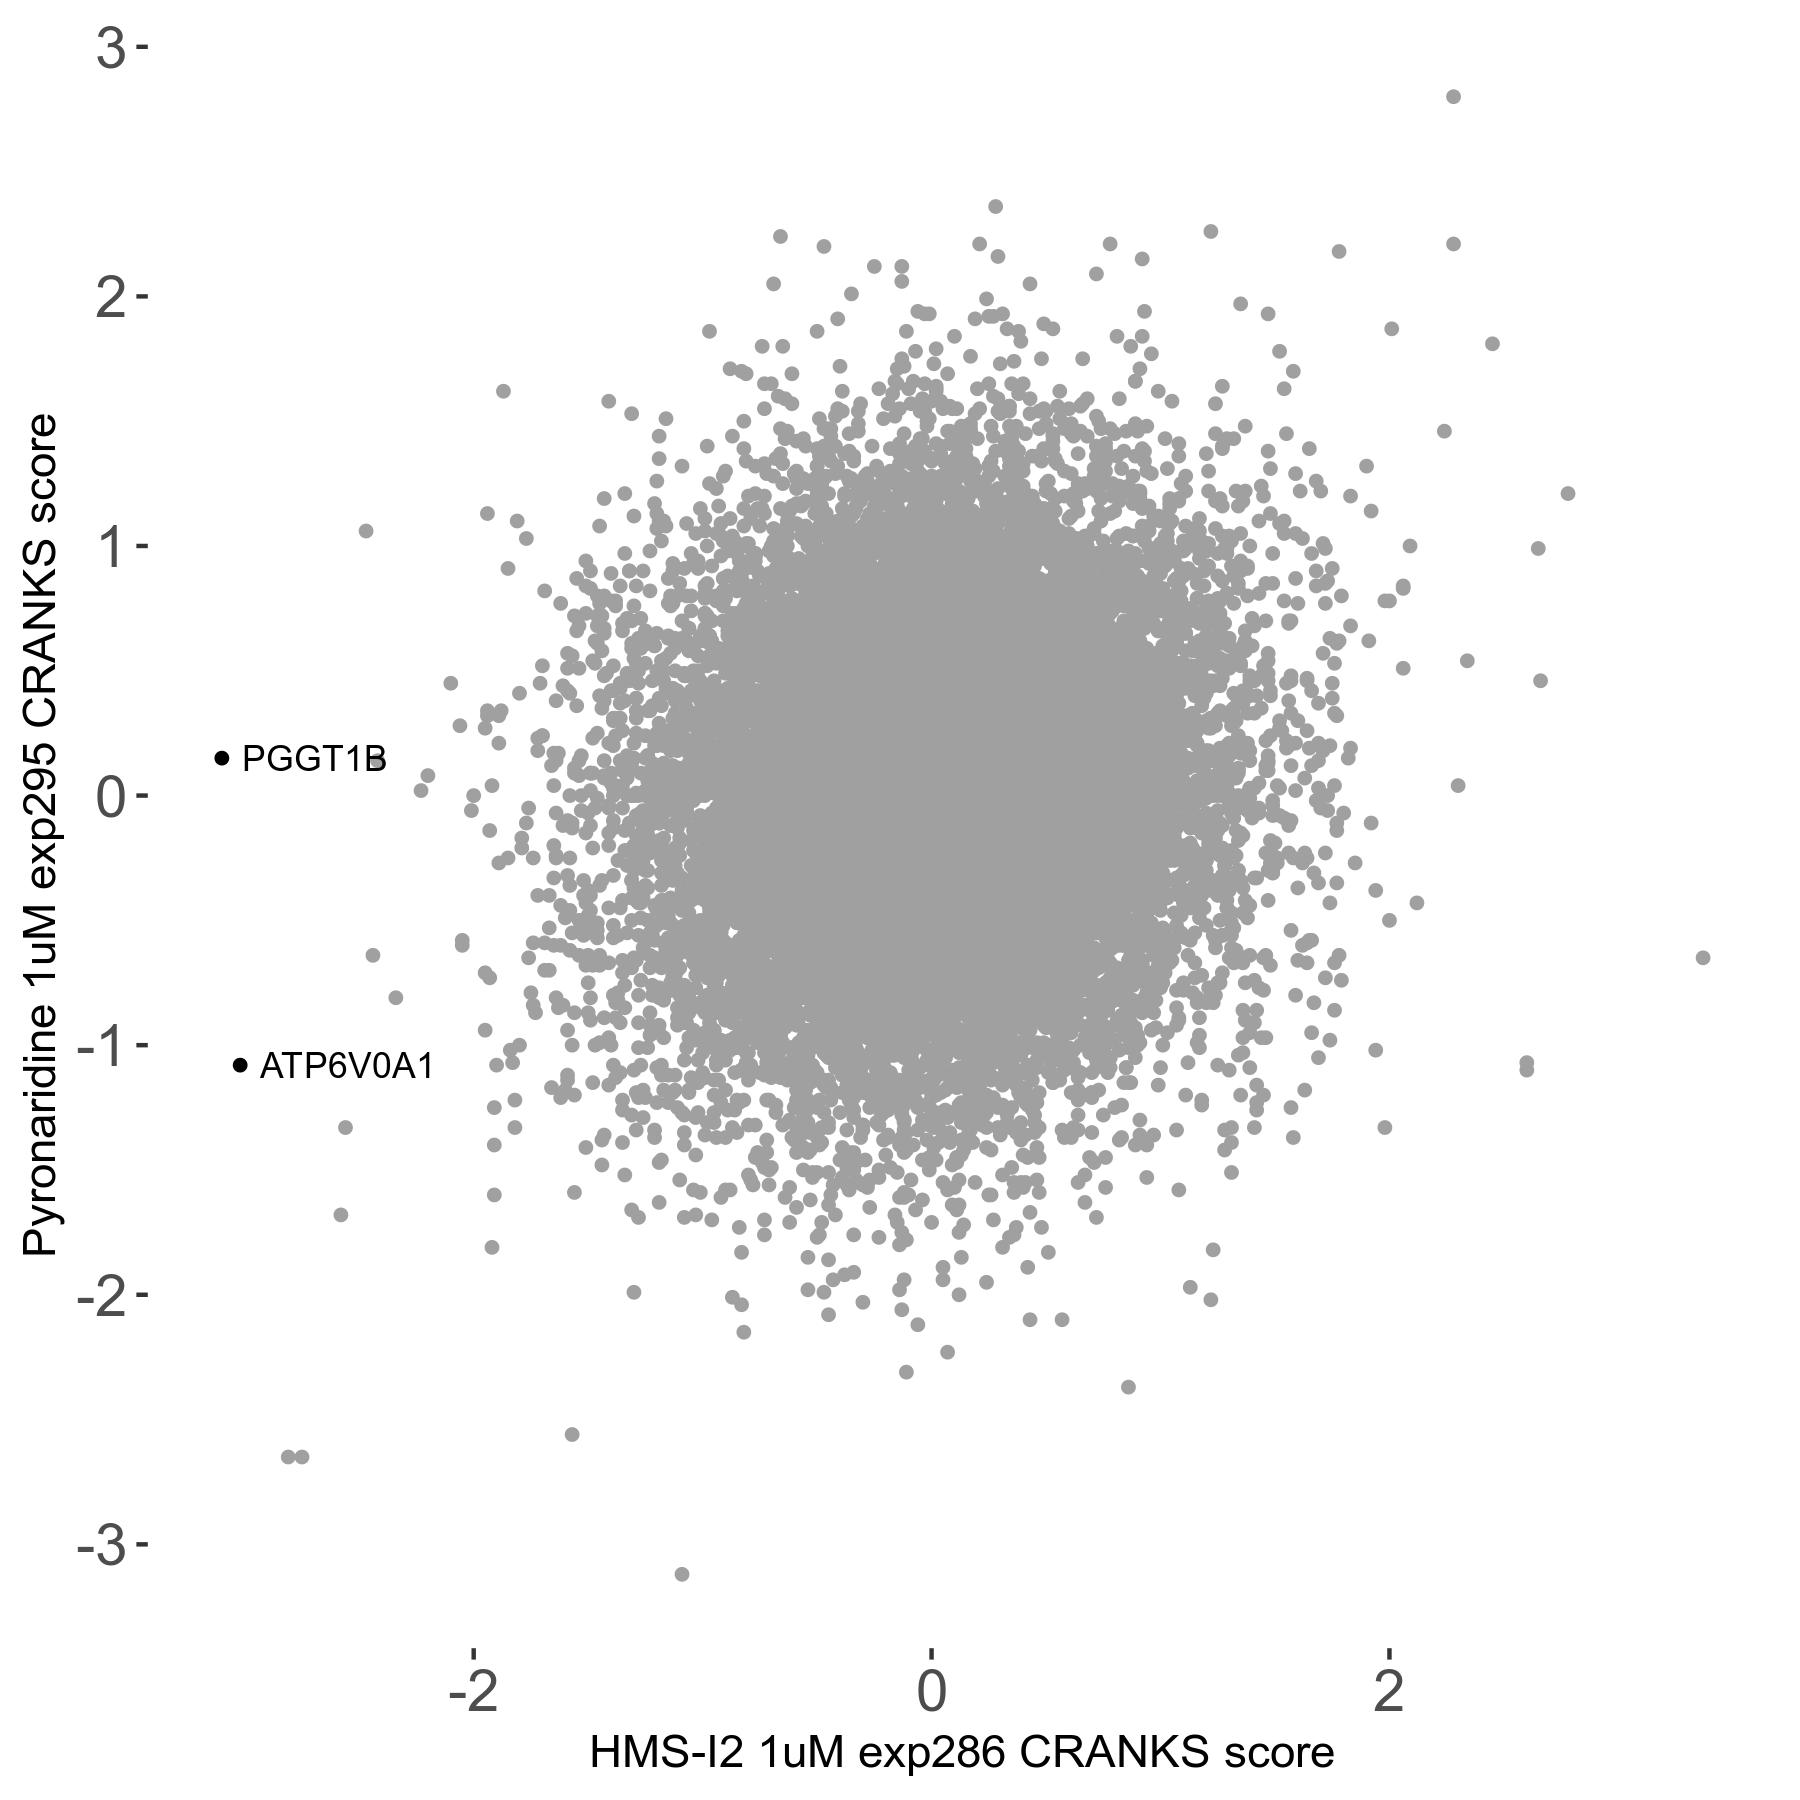
HMS-I2 1μM R06 exp286 vs Pyronaridine 1μM R06 exp295
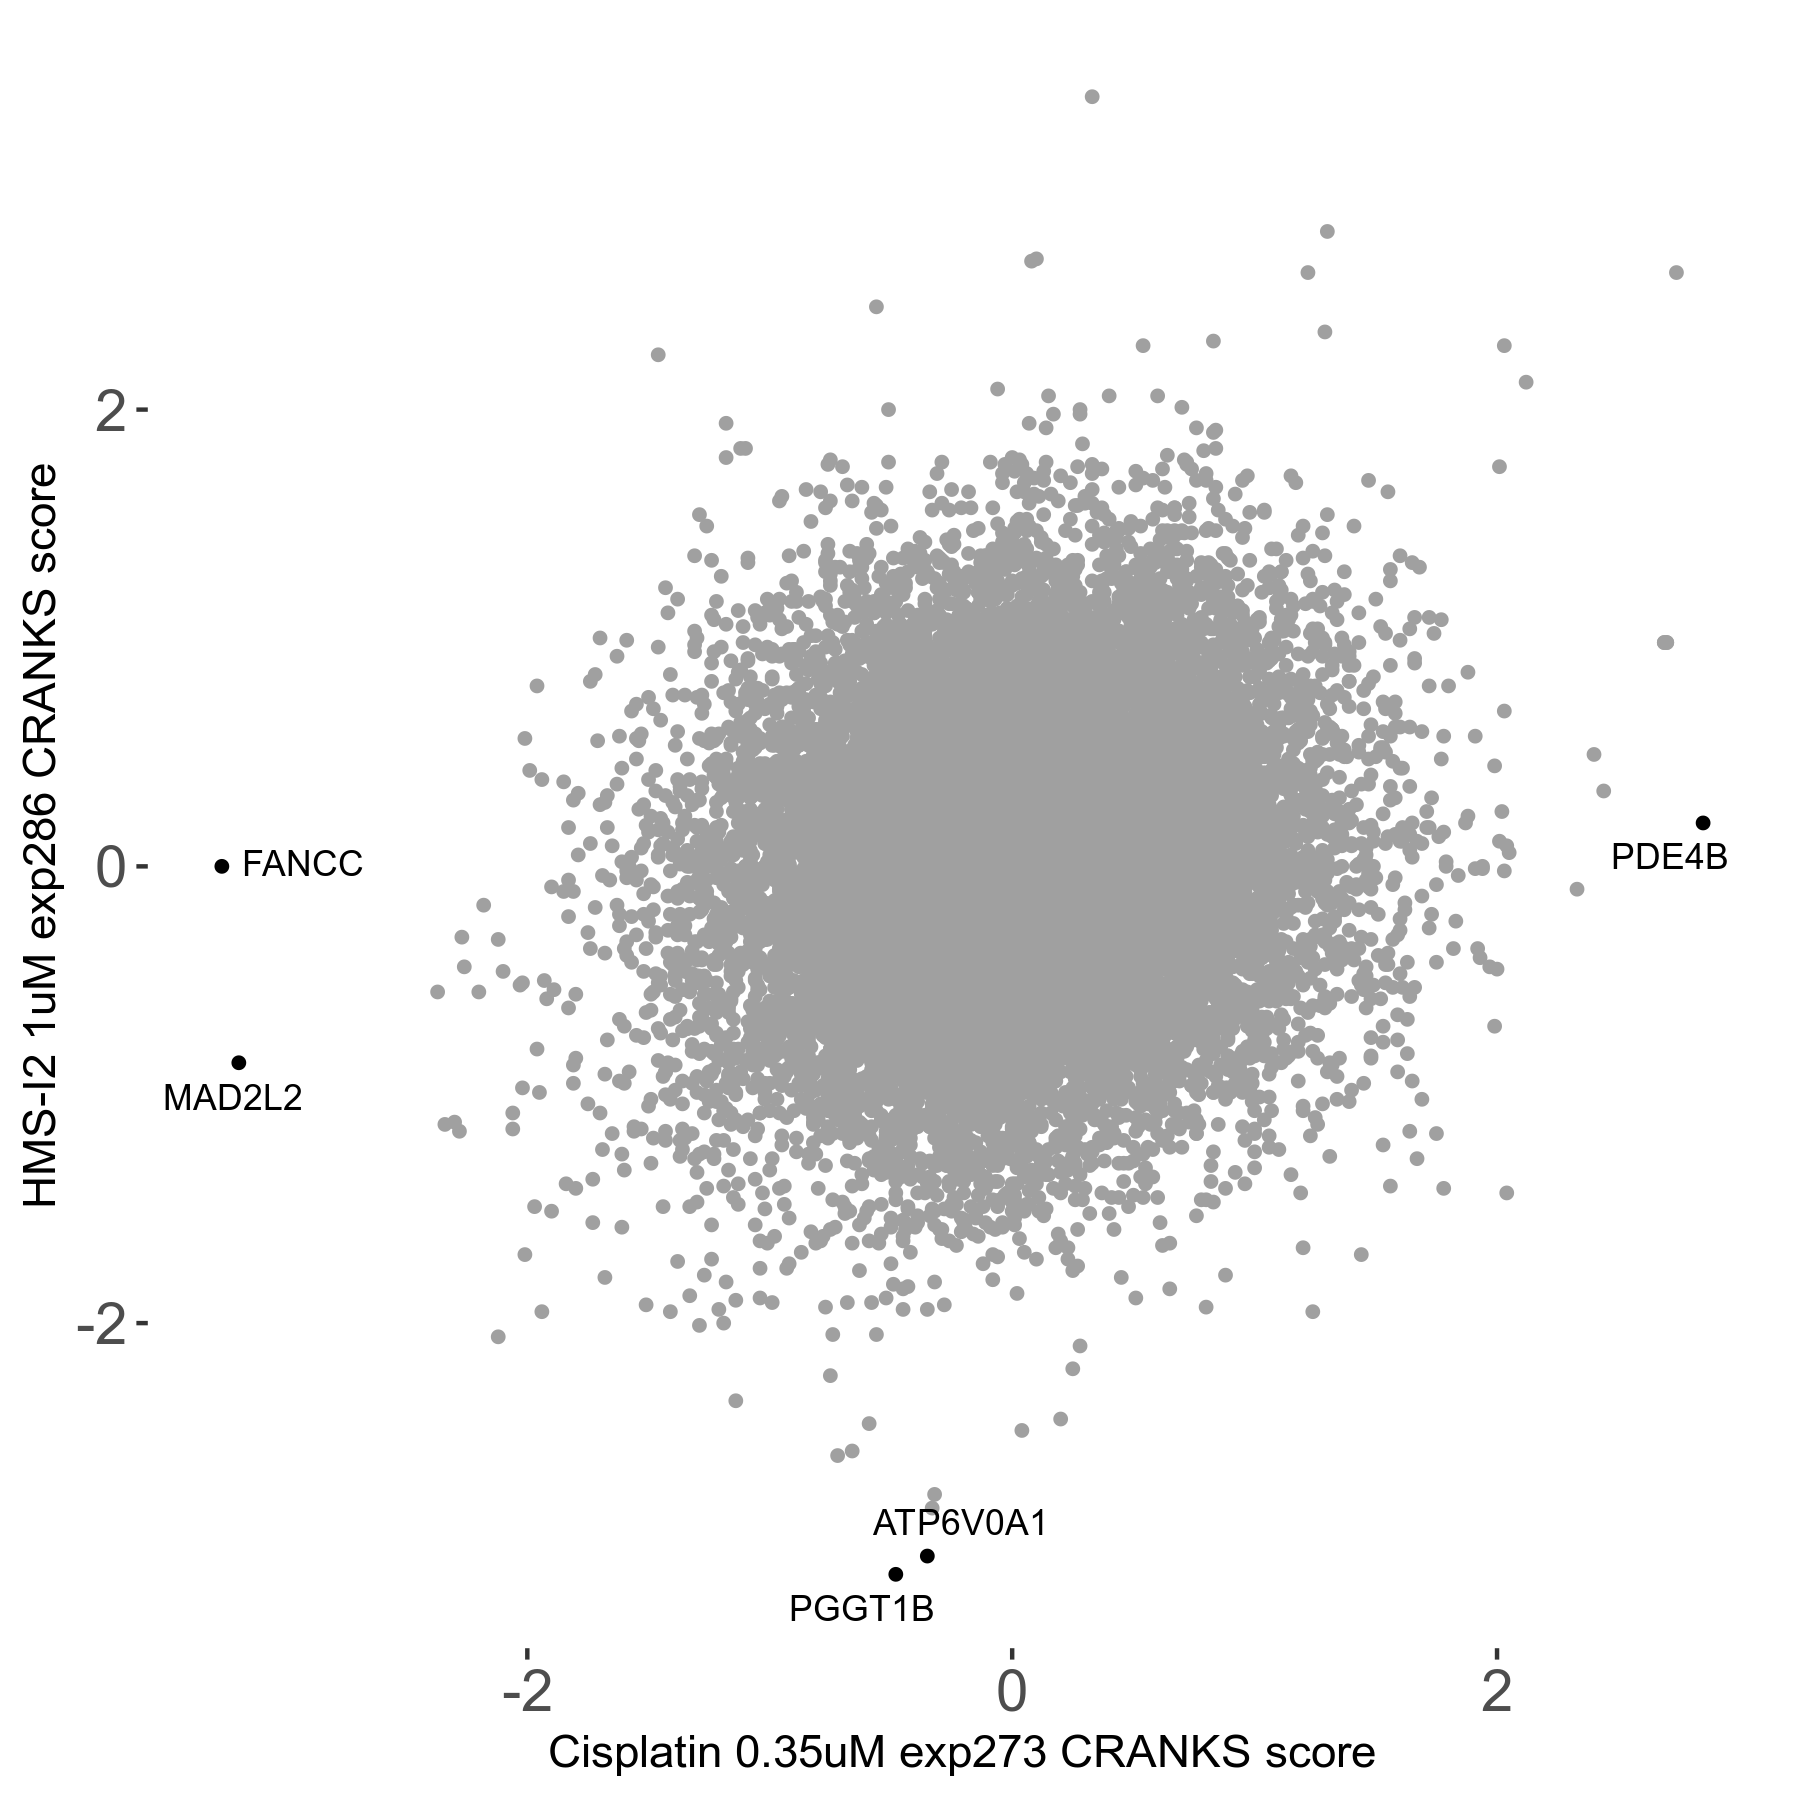
Cisplatin 0.35μM R06 exp273 vs HMS-I2 1μM R06 exp286
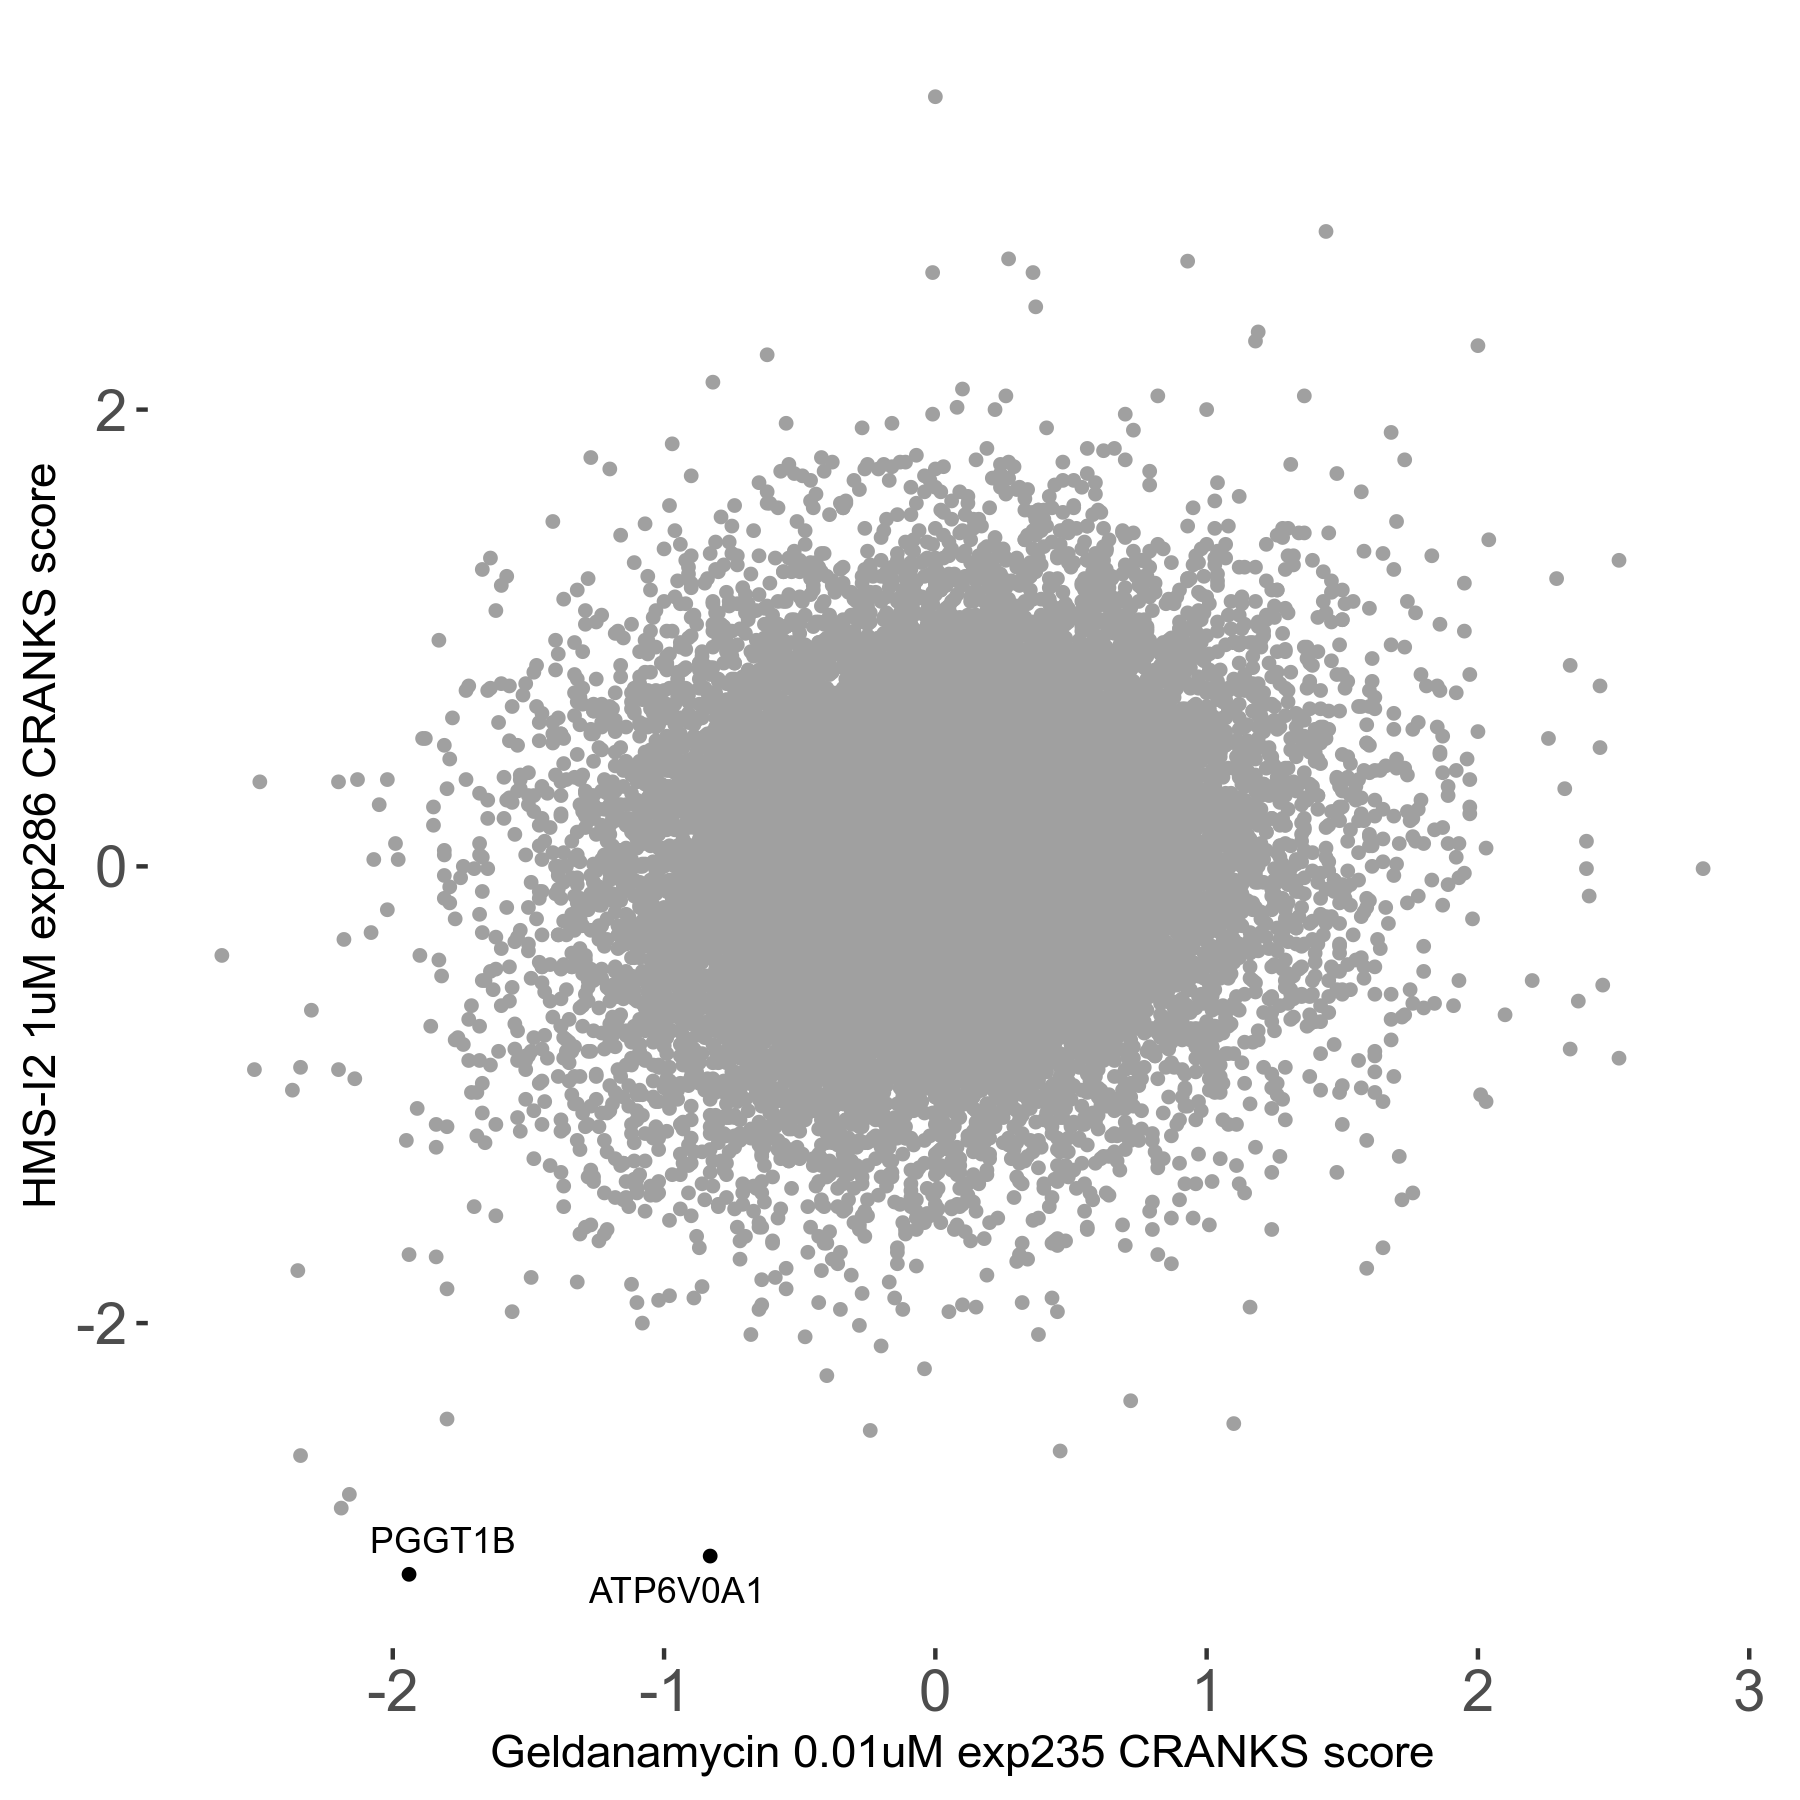
Geldanamycin 0.01μM R05 exp235 vs HMS-I2 1μM R06 exp286