Table of Contents
Dexamethasone 0.006 to 0.015μM on day4 R07 exp352
Mechanism of Action
Glucocorticoid receptor agonist, anti-inflammatory
- Class / Subclass 1: Metabolism / Hormone Agonist
- Class / Subclass 2: Signal Transduction / GPCR Agonist
Technical Notes
Protein References
- PubChem Name: Dexamethasone
- Synonyms: Hexadecadrol; Prednisolone F
- CAS #: 50-02-2
- PubChem CID: 5743
- IUPAC: (8S,9R,10S,11S,13S,14S,16R,17R)-9-fluoro-11,17-dihydroxy-17-(2-hydroxyacetyl)-10,13,16-trimethyl-6,7,8,11,12,14,15,16-octahydrocyclopenta[a]phenanthren-3-one
- INCHI Name: InChI=1S/C22H29FO5/c1-12-8-16-15-5-4-13-9-14(25)6-7-19(13,2)21(15,23)17(26)10-20(16,3)22(12,28)18(27)11-24/h6-7,9,12,15-17,24,26,28H,4-5,8,10-11H2,1-3H3/t12-,15+,16+,17+,19+,20+,21+,22+/m1/s1
- INCHI Key: UREBDLICKHMUKA-CXSFZGCWSA-N
- Molecular Weight: 392.5
- Canonical SMILES: CC1CC2C3CCC4=CC(=O)C=CC4(C3(C(CC2(C1(C(=O)CO)O)C)O)F)C
- Isomeric SMILES: C[C@@H]1C[C@H]2[C@@H]3CCC4=CC(=O)C=C[C@@]4([C@]3([C@H](C[C@@]2([C@]1(C(=O)CO)O)C)O)F)C
- Molecular Formula: C22H29FO5

Protein Supplier
- Supplier Name: Sigma-Aldrich
- Catalog #: D4902
- Lot #: N/A
Protein Characterization
- HRMS (ESI-TOF) m/z: (M+H)+ Calcd for C22H29FO5 393.20718; found 393.2068
Dose Response Curve
- Platform ID: Dexamethasone
- Min: -4.7517; Max: 71.3612

| IC | Concentration (µM) |
|---|---|
| IC10 | N/A |
| IC20 | 0.0111 |
| IC30 | 0.0159 |
| IC40 | 0.0223 |
| IC50 | 0.0178 |
| IC60 | N/A |
| IC70 | 0.2312 |
| IC80 | N/A |
| IC90 | N/A |
Screen Summary
- Round: 07
- Dose: 0.006-0.015µM
- Days of incubation: 8
- Doublings: 5.2
- Numbers of reads: 14131811
Screen Results
| Sensitive/Resistant hits (FDR<0.05) | CRANKS | Score Plot | Top 30 Genes | Screen Similarity | Top 30 Sensitive GO terms | Top 30 Resistant GO terms |
|---|---|---|---|---|---|---|
| 13/45 | Scores |
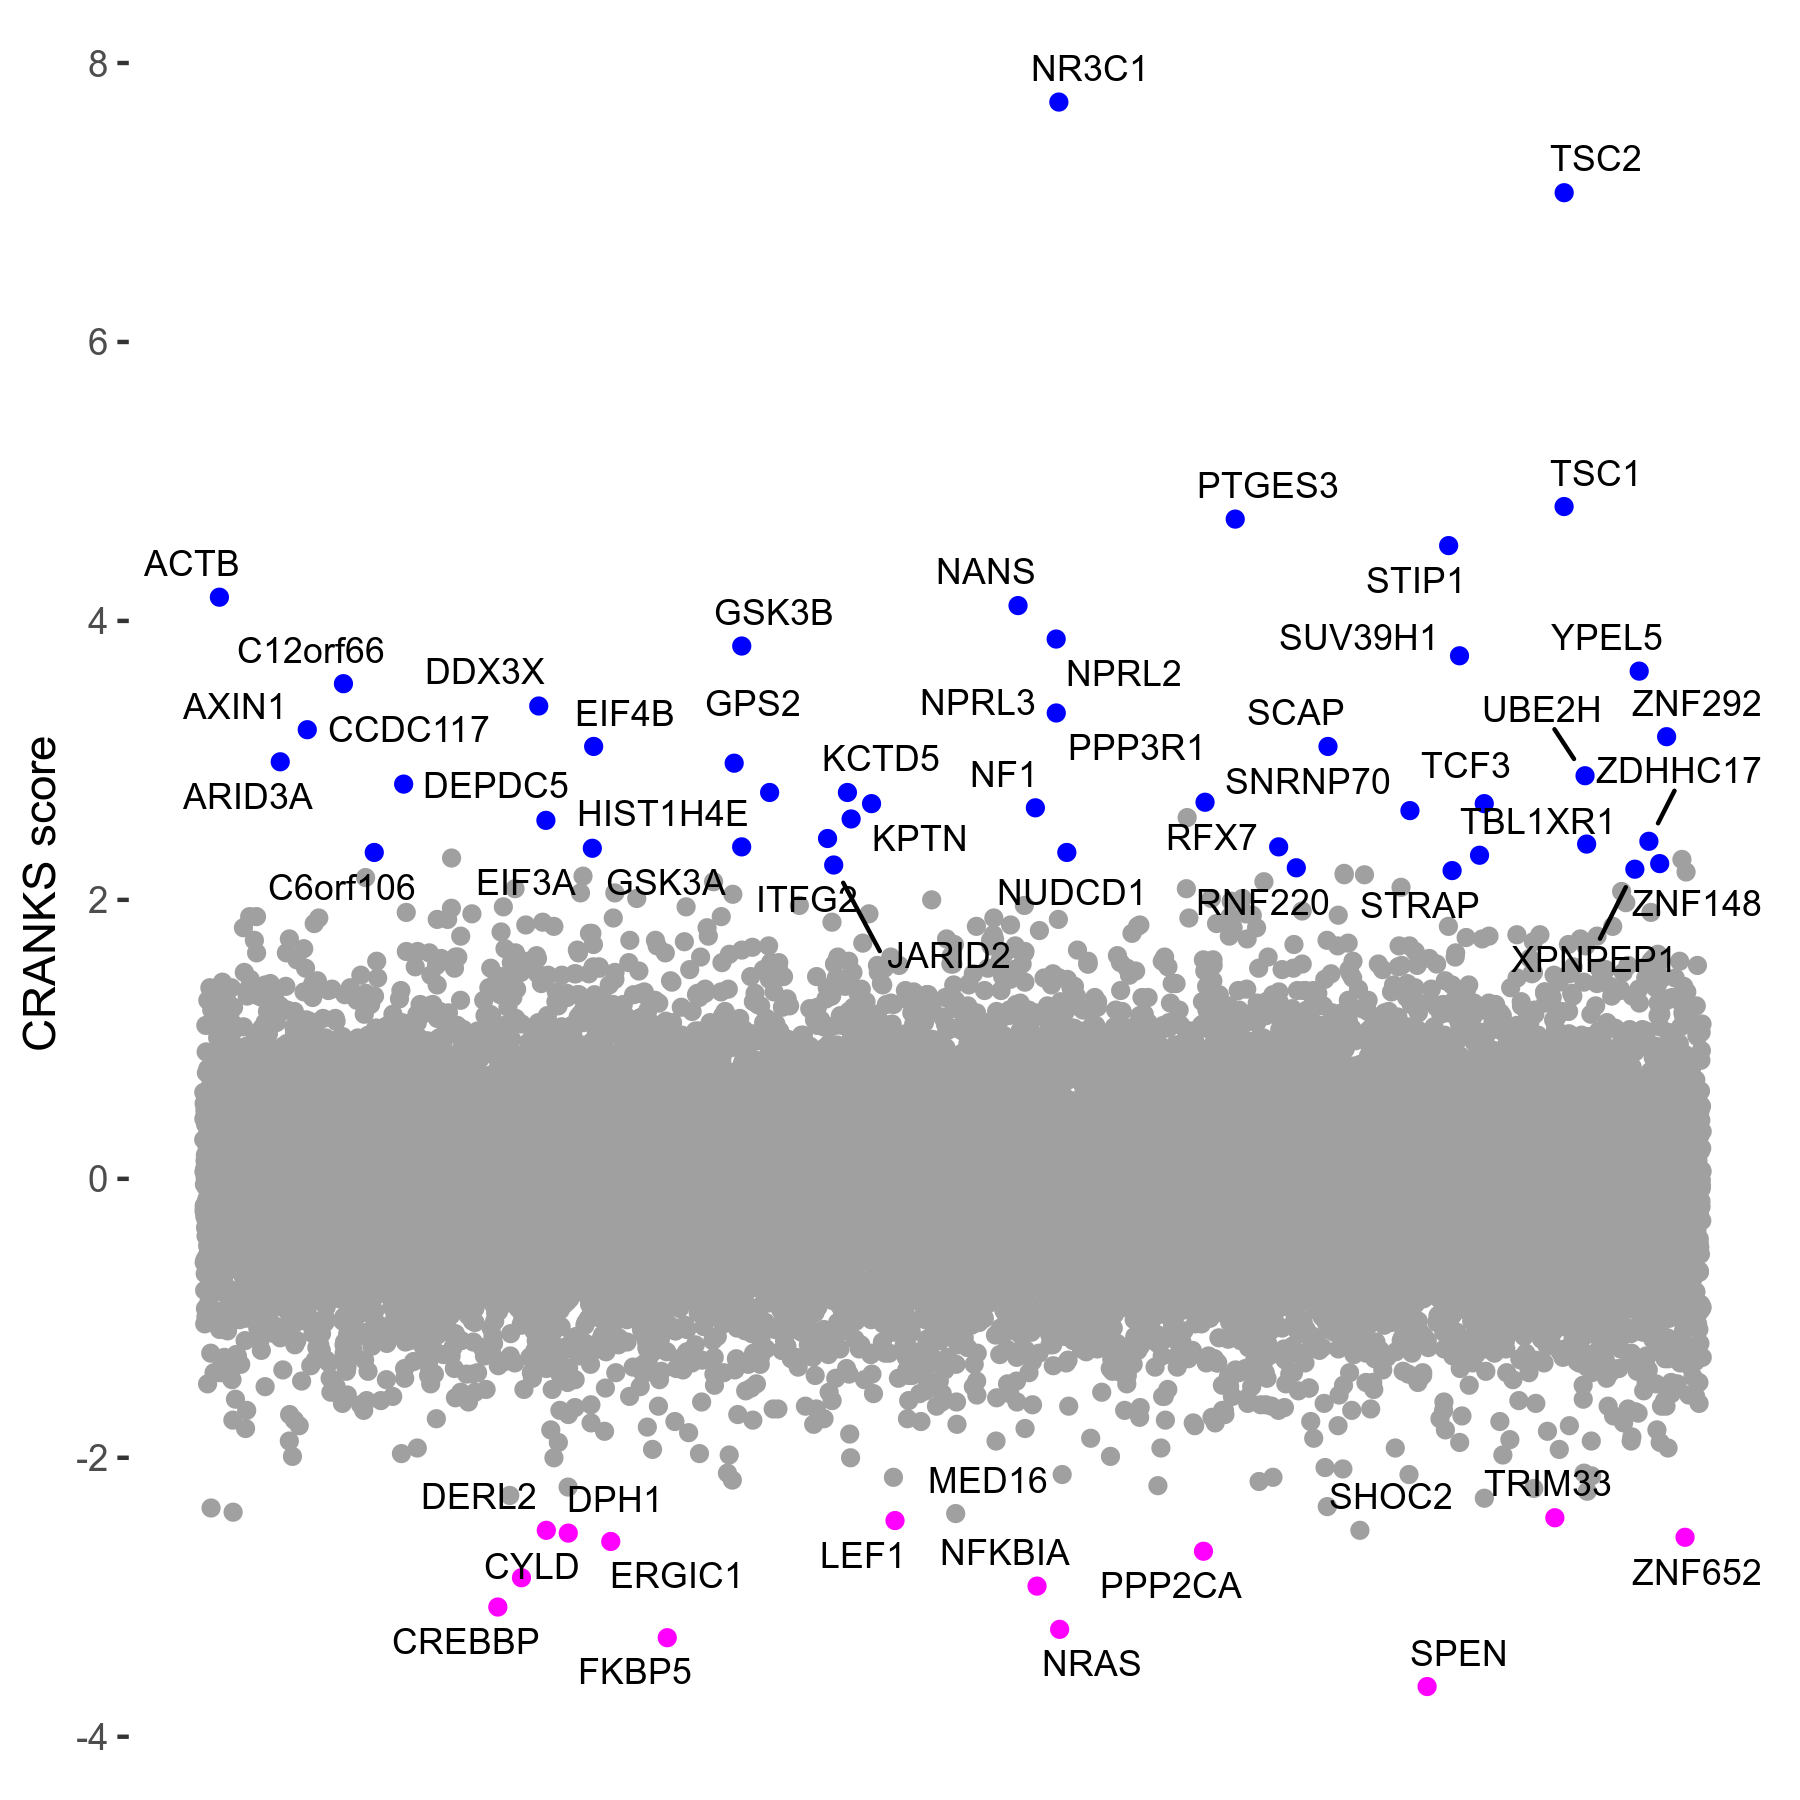
Dexamethasone 0.006 to 0.015μM on day4 R07 exp352
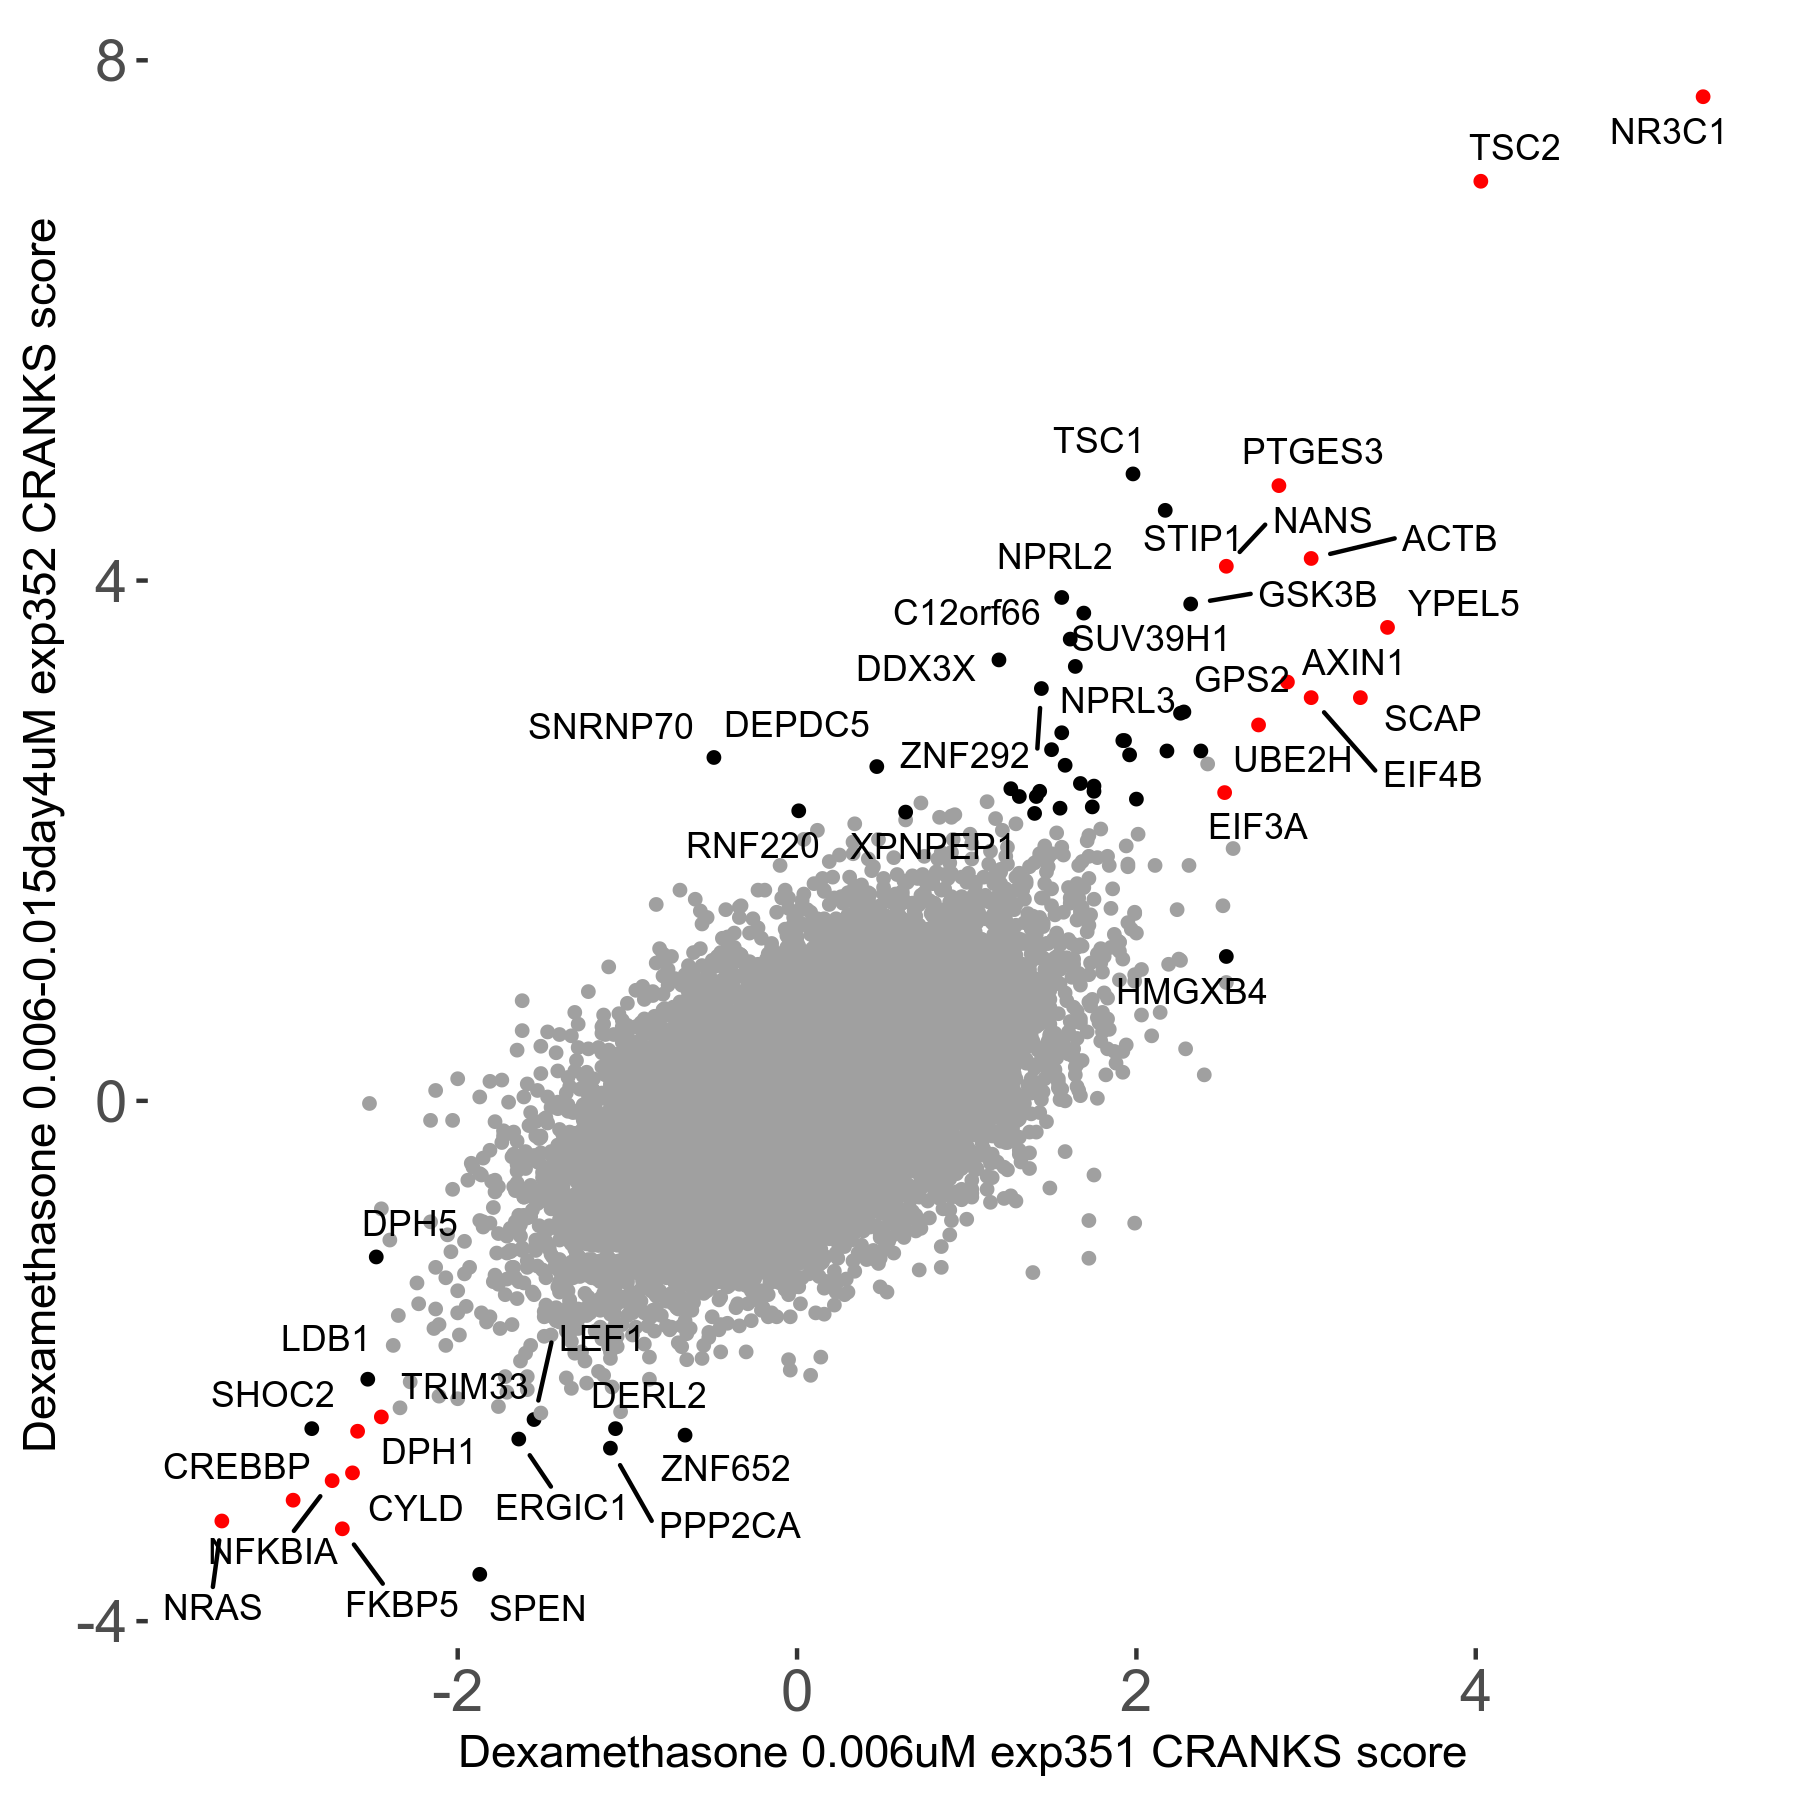
Dexamethasone 0.006 to 0.015μM on day4 R07 exp352 vs Dexamethasone 0.006μM R07 exp351
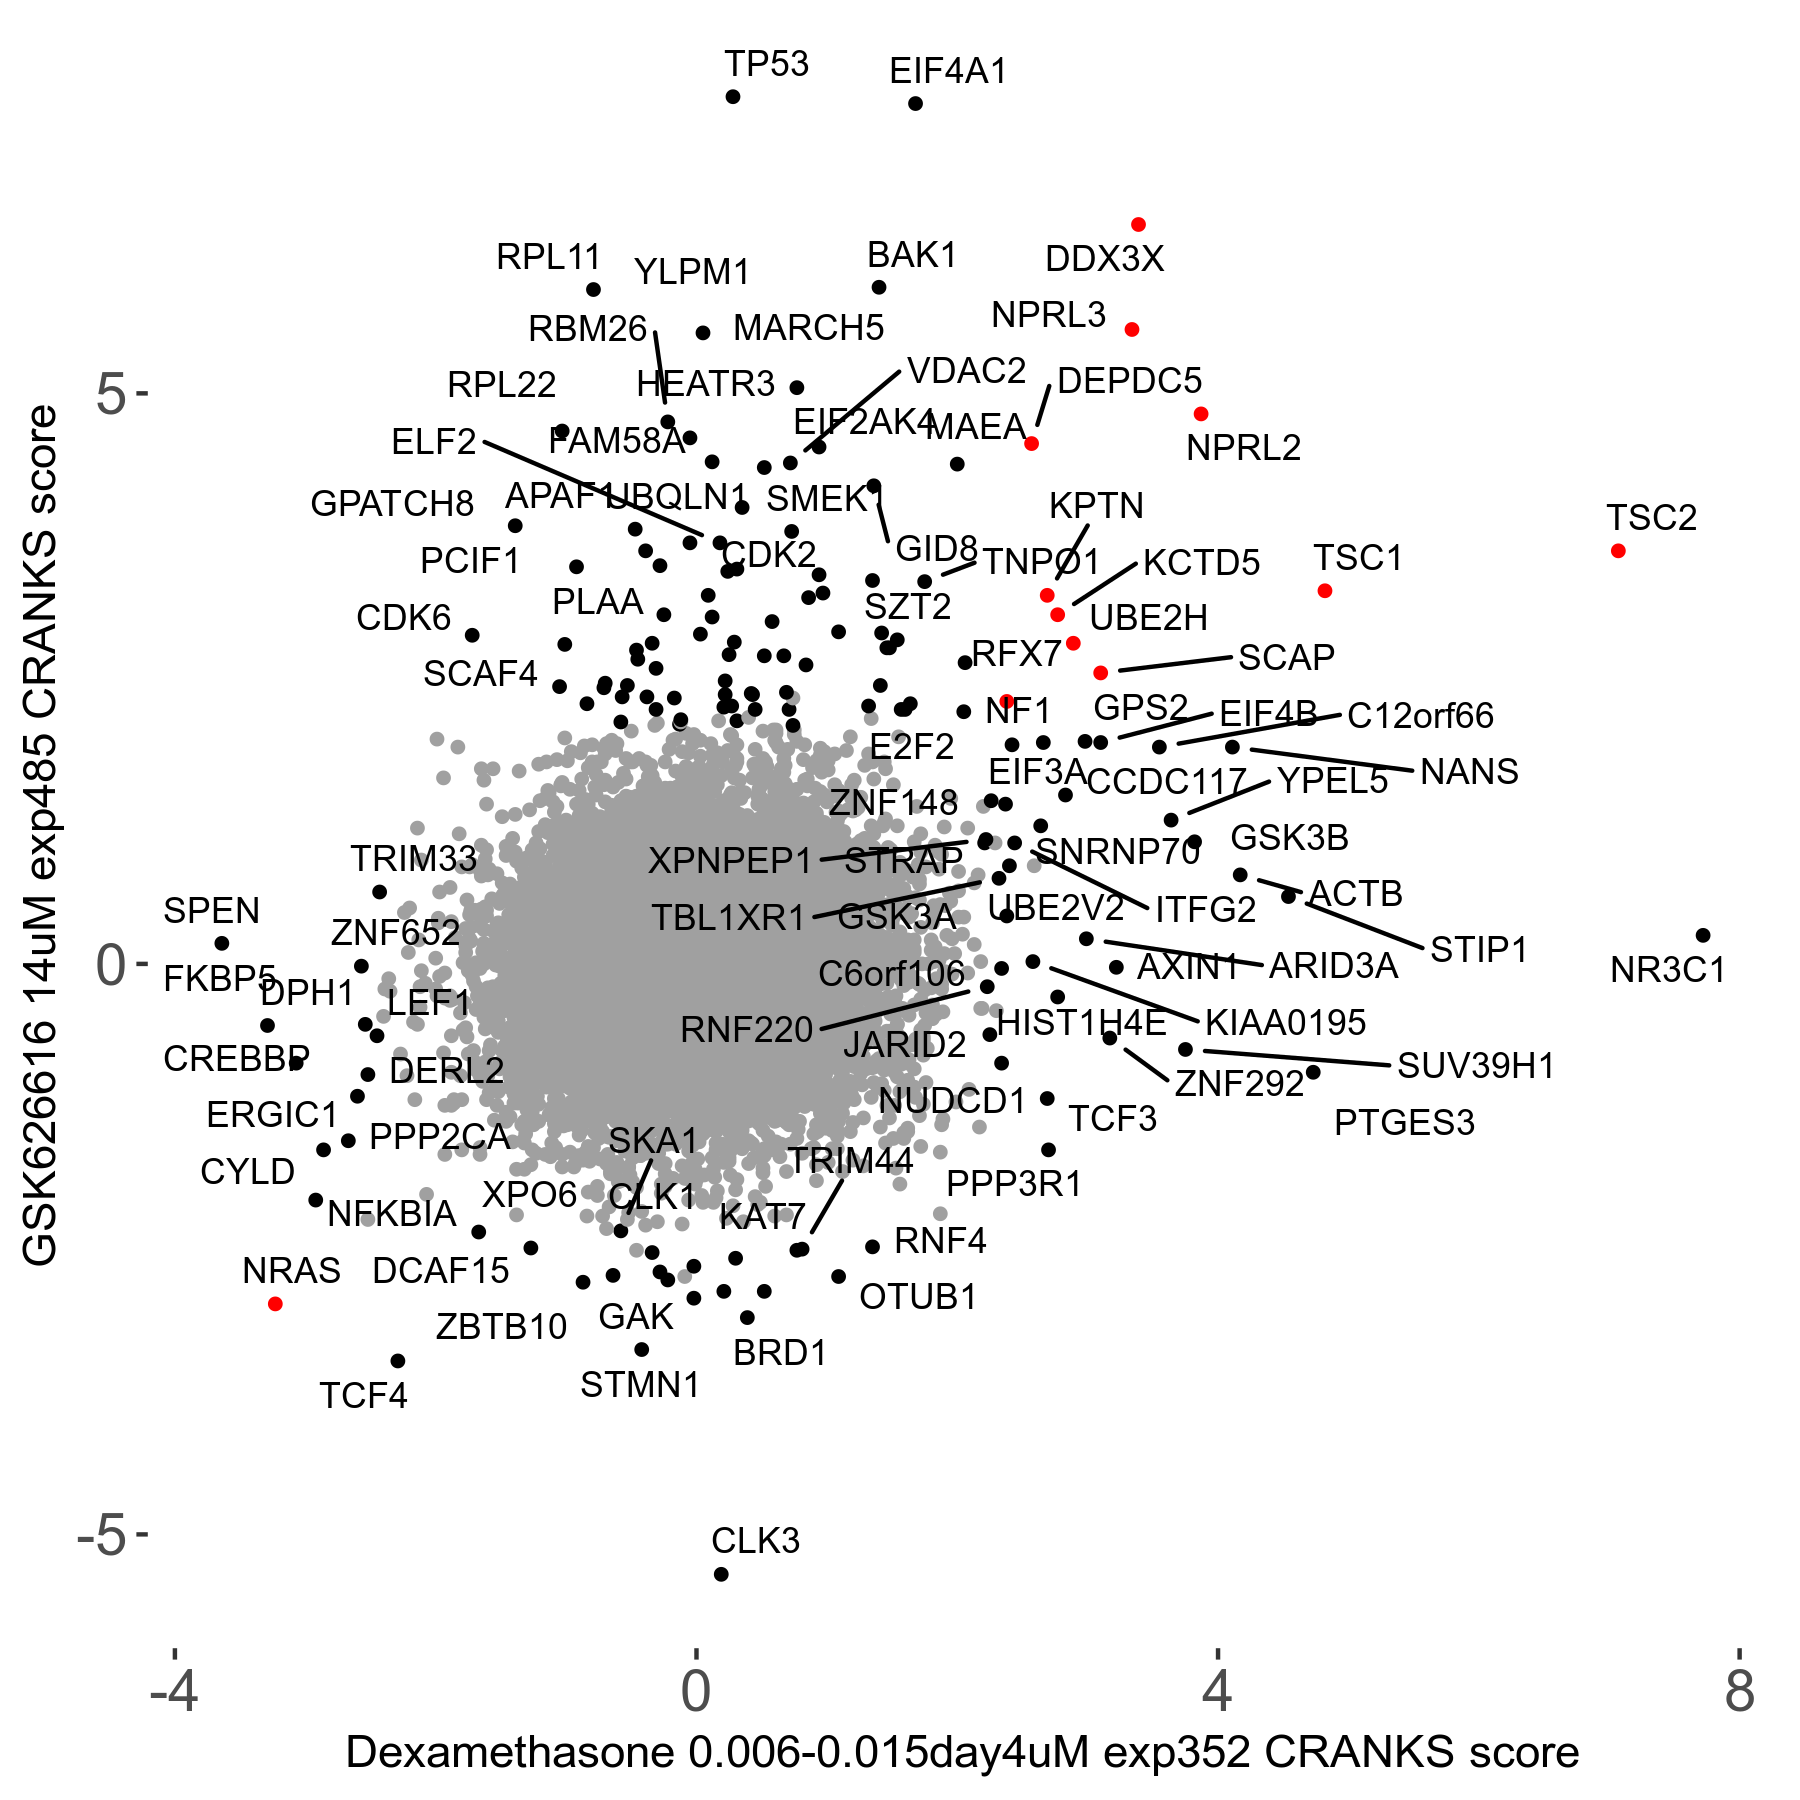
Dexamethasone 0.006 to 0.015μM on day4 R07 exp352 vs GSK626616 14μM R08 exp485
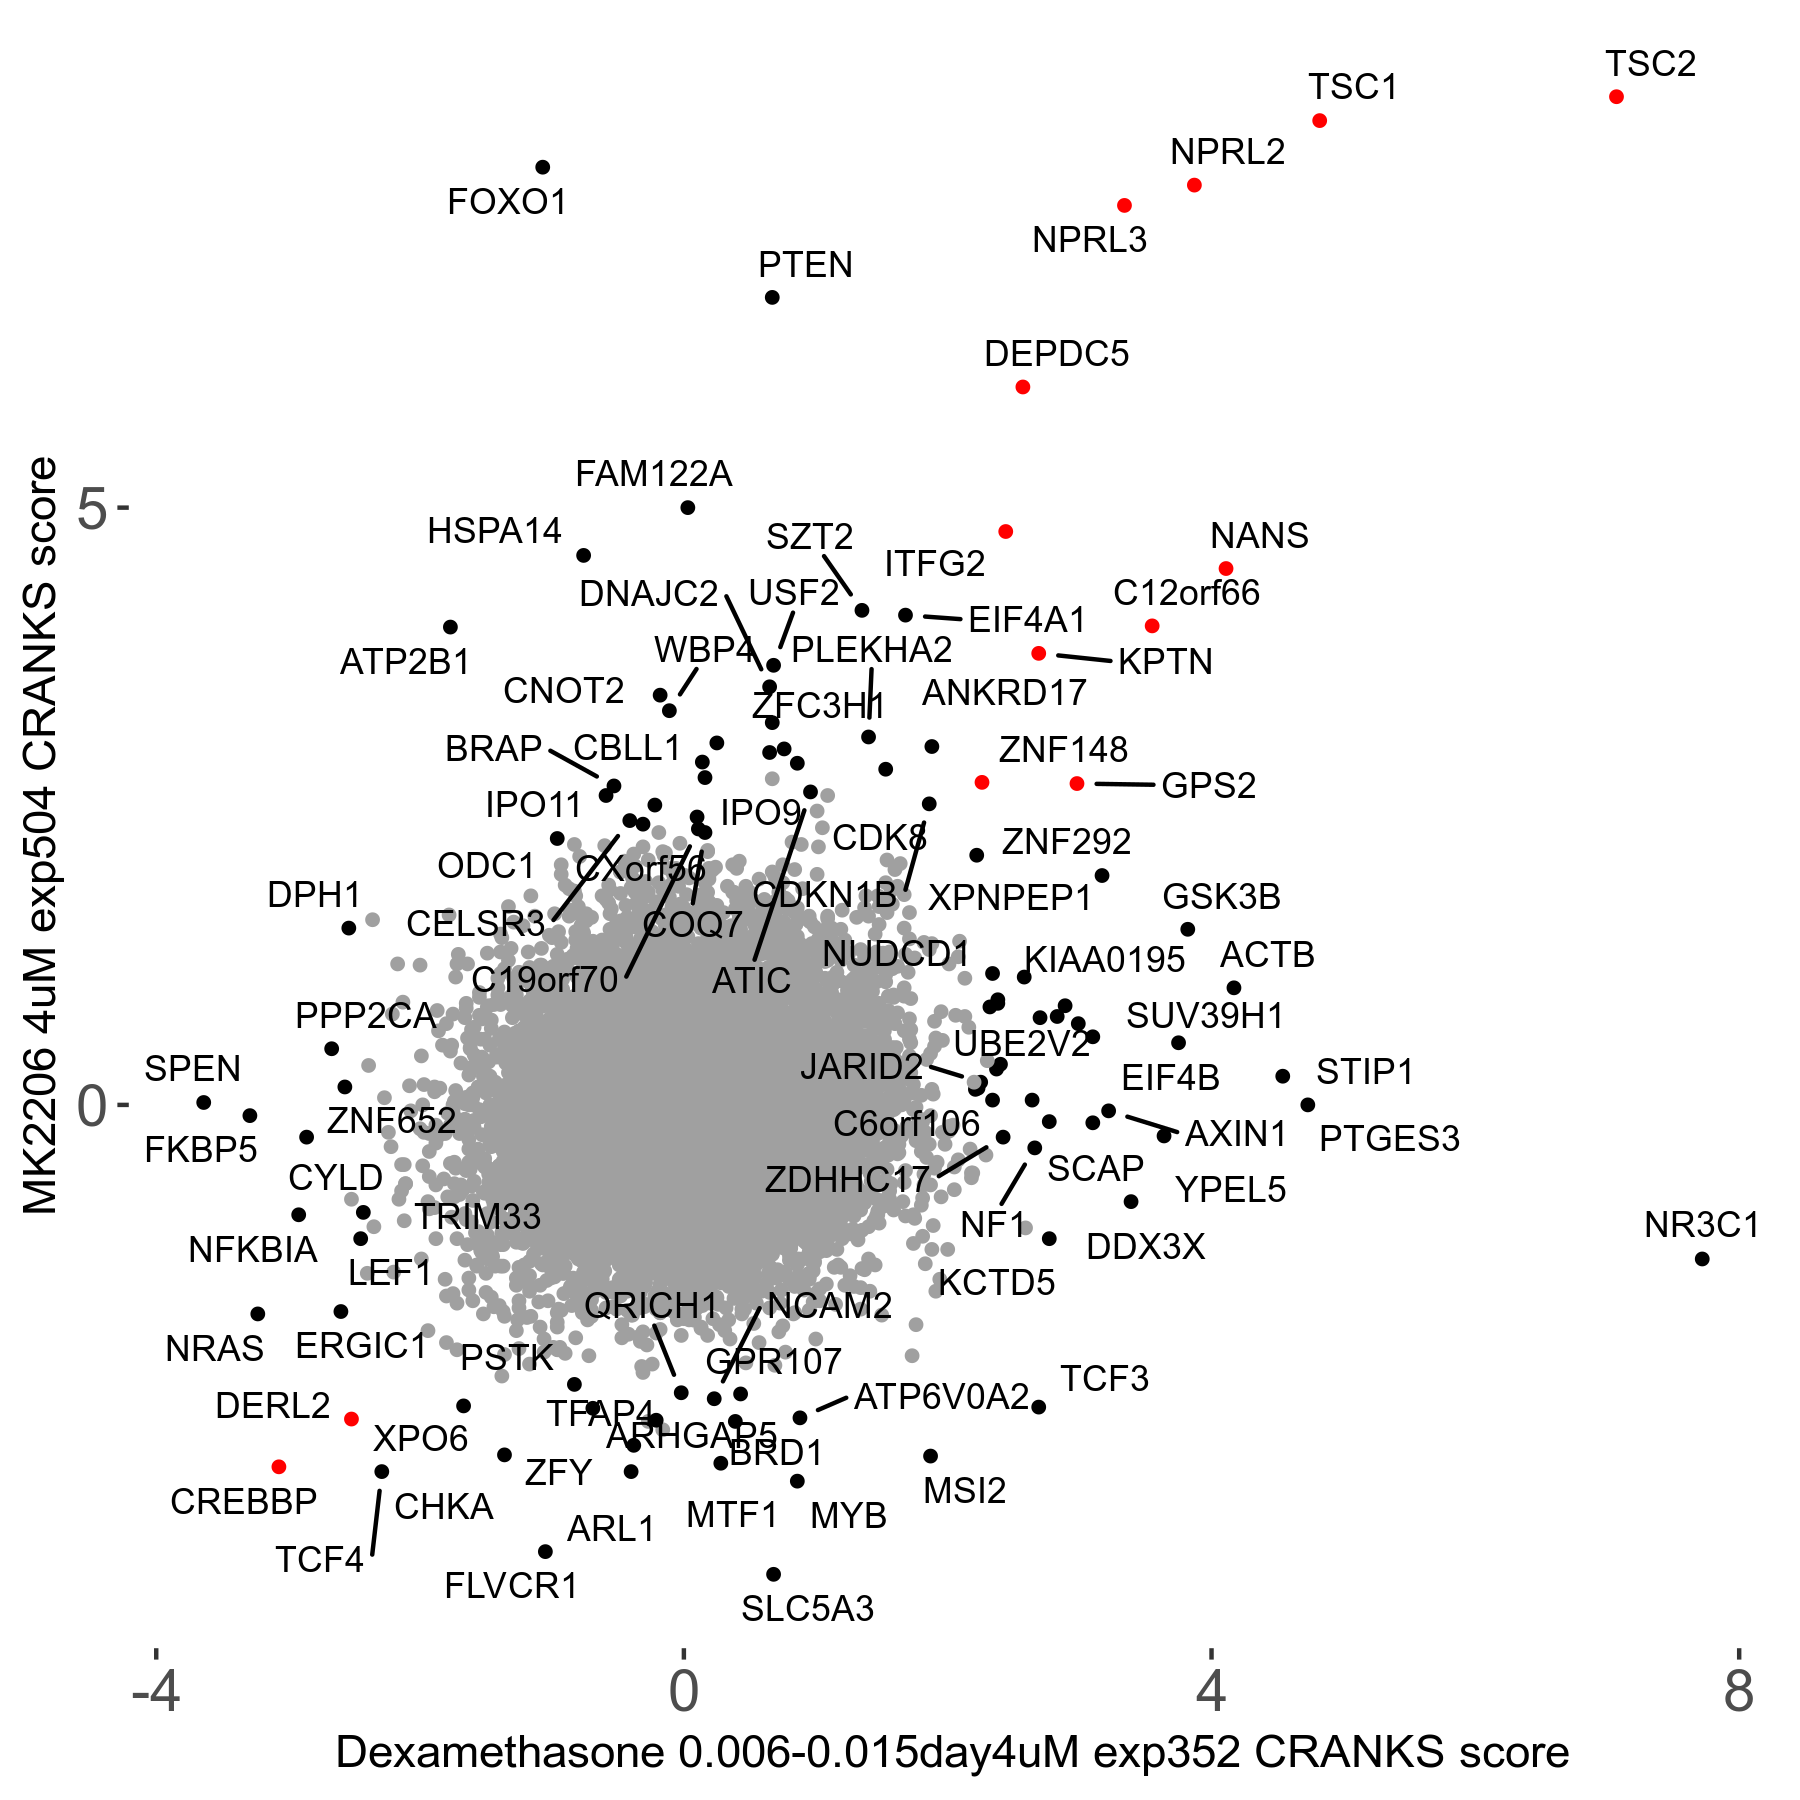
Dexamethasone 0.006 to 0.015μM on day4 R07 exp352 vs MK2206 4μM R08 exp504
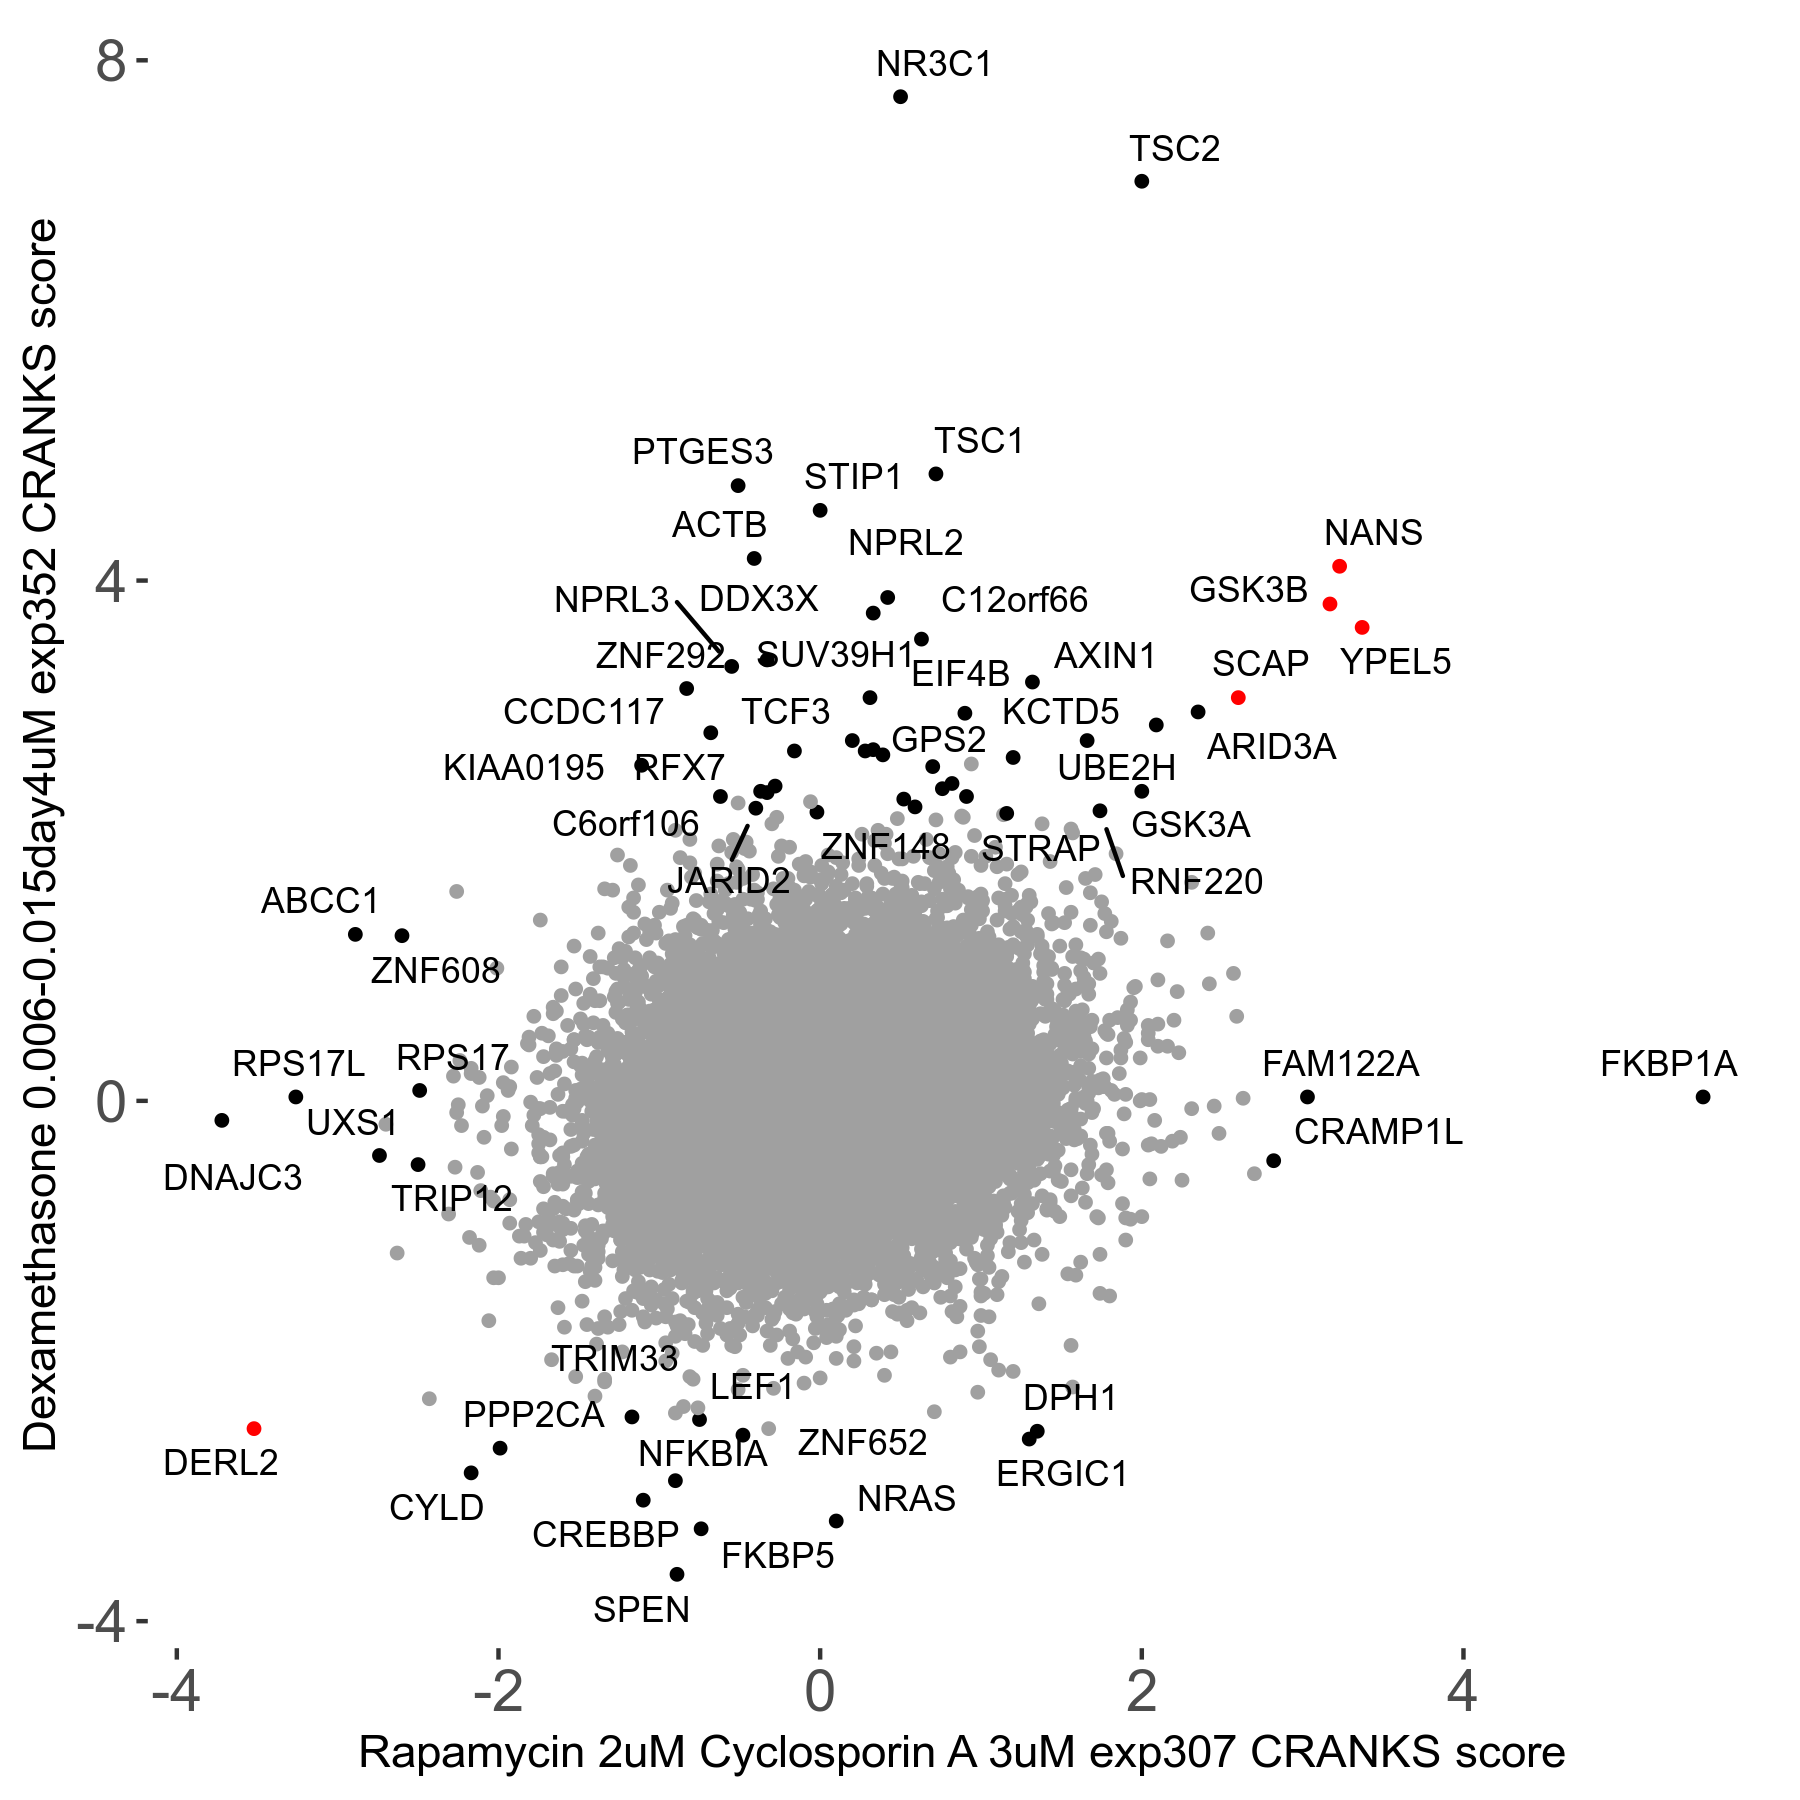
Dexamethasone 0.006 to 0.015μM on day4 R07 exp352 vs Rapamycin 2μM plus Cyclosporin-A 3μM R07 exp307
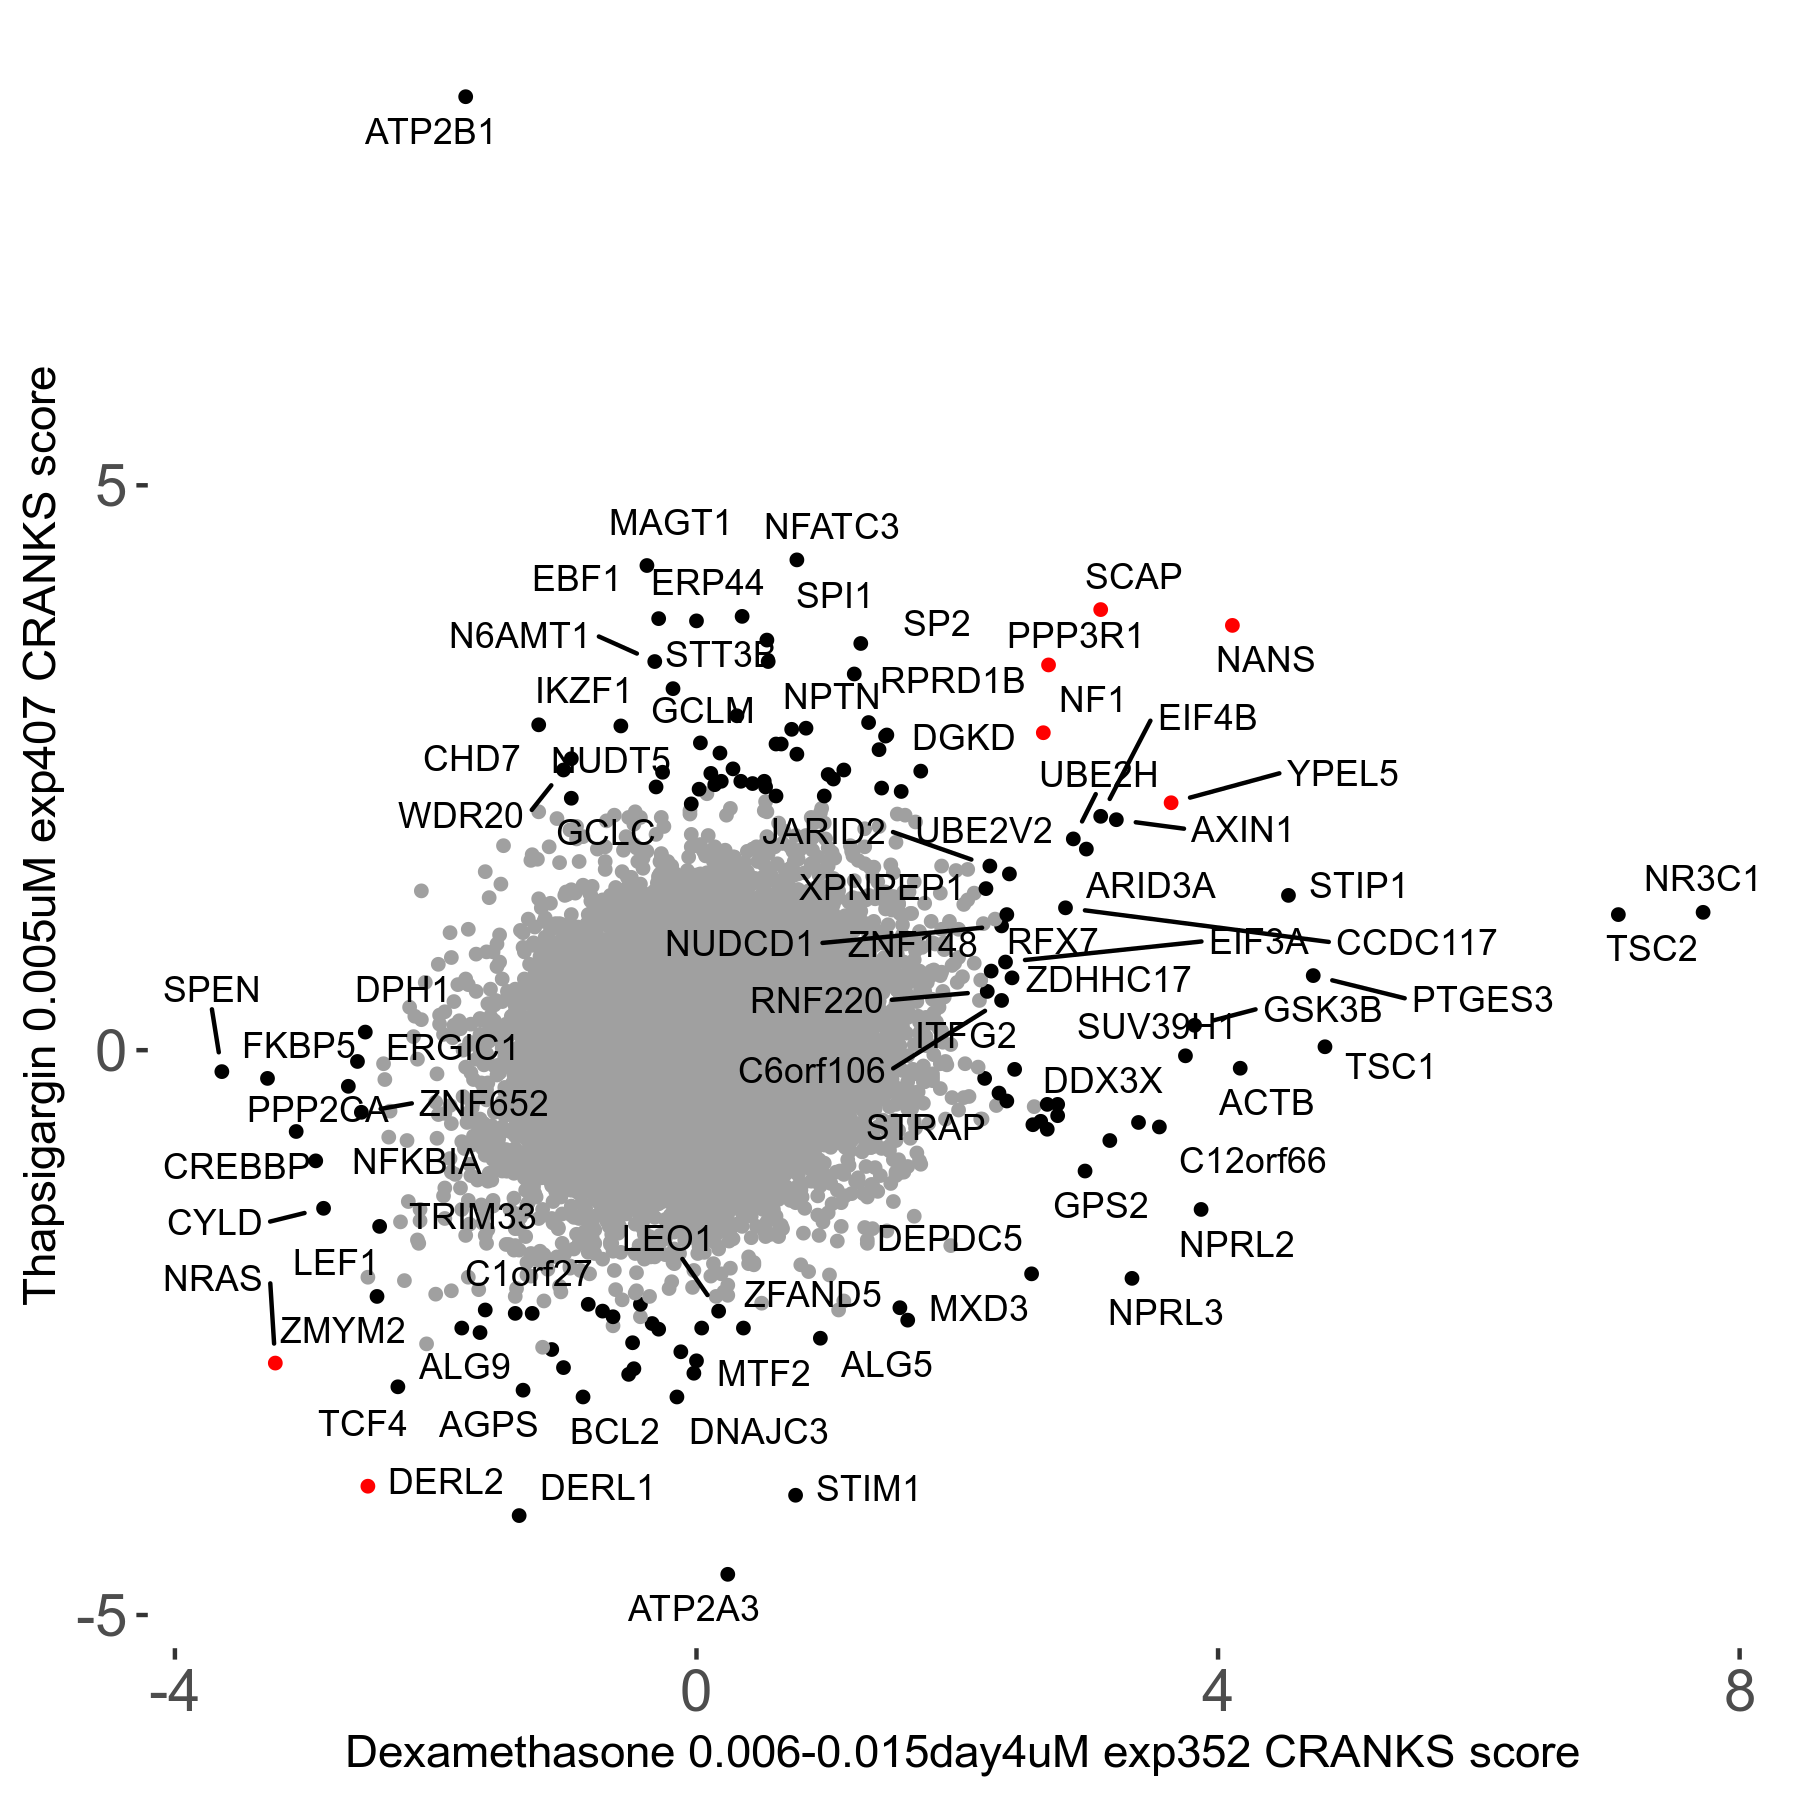
Dexamethasone 0.006 to 0.015μM on day4 R07 exp352 vs Thapsigargin 0.005μM R07 exp407
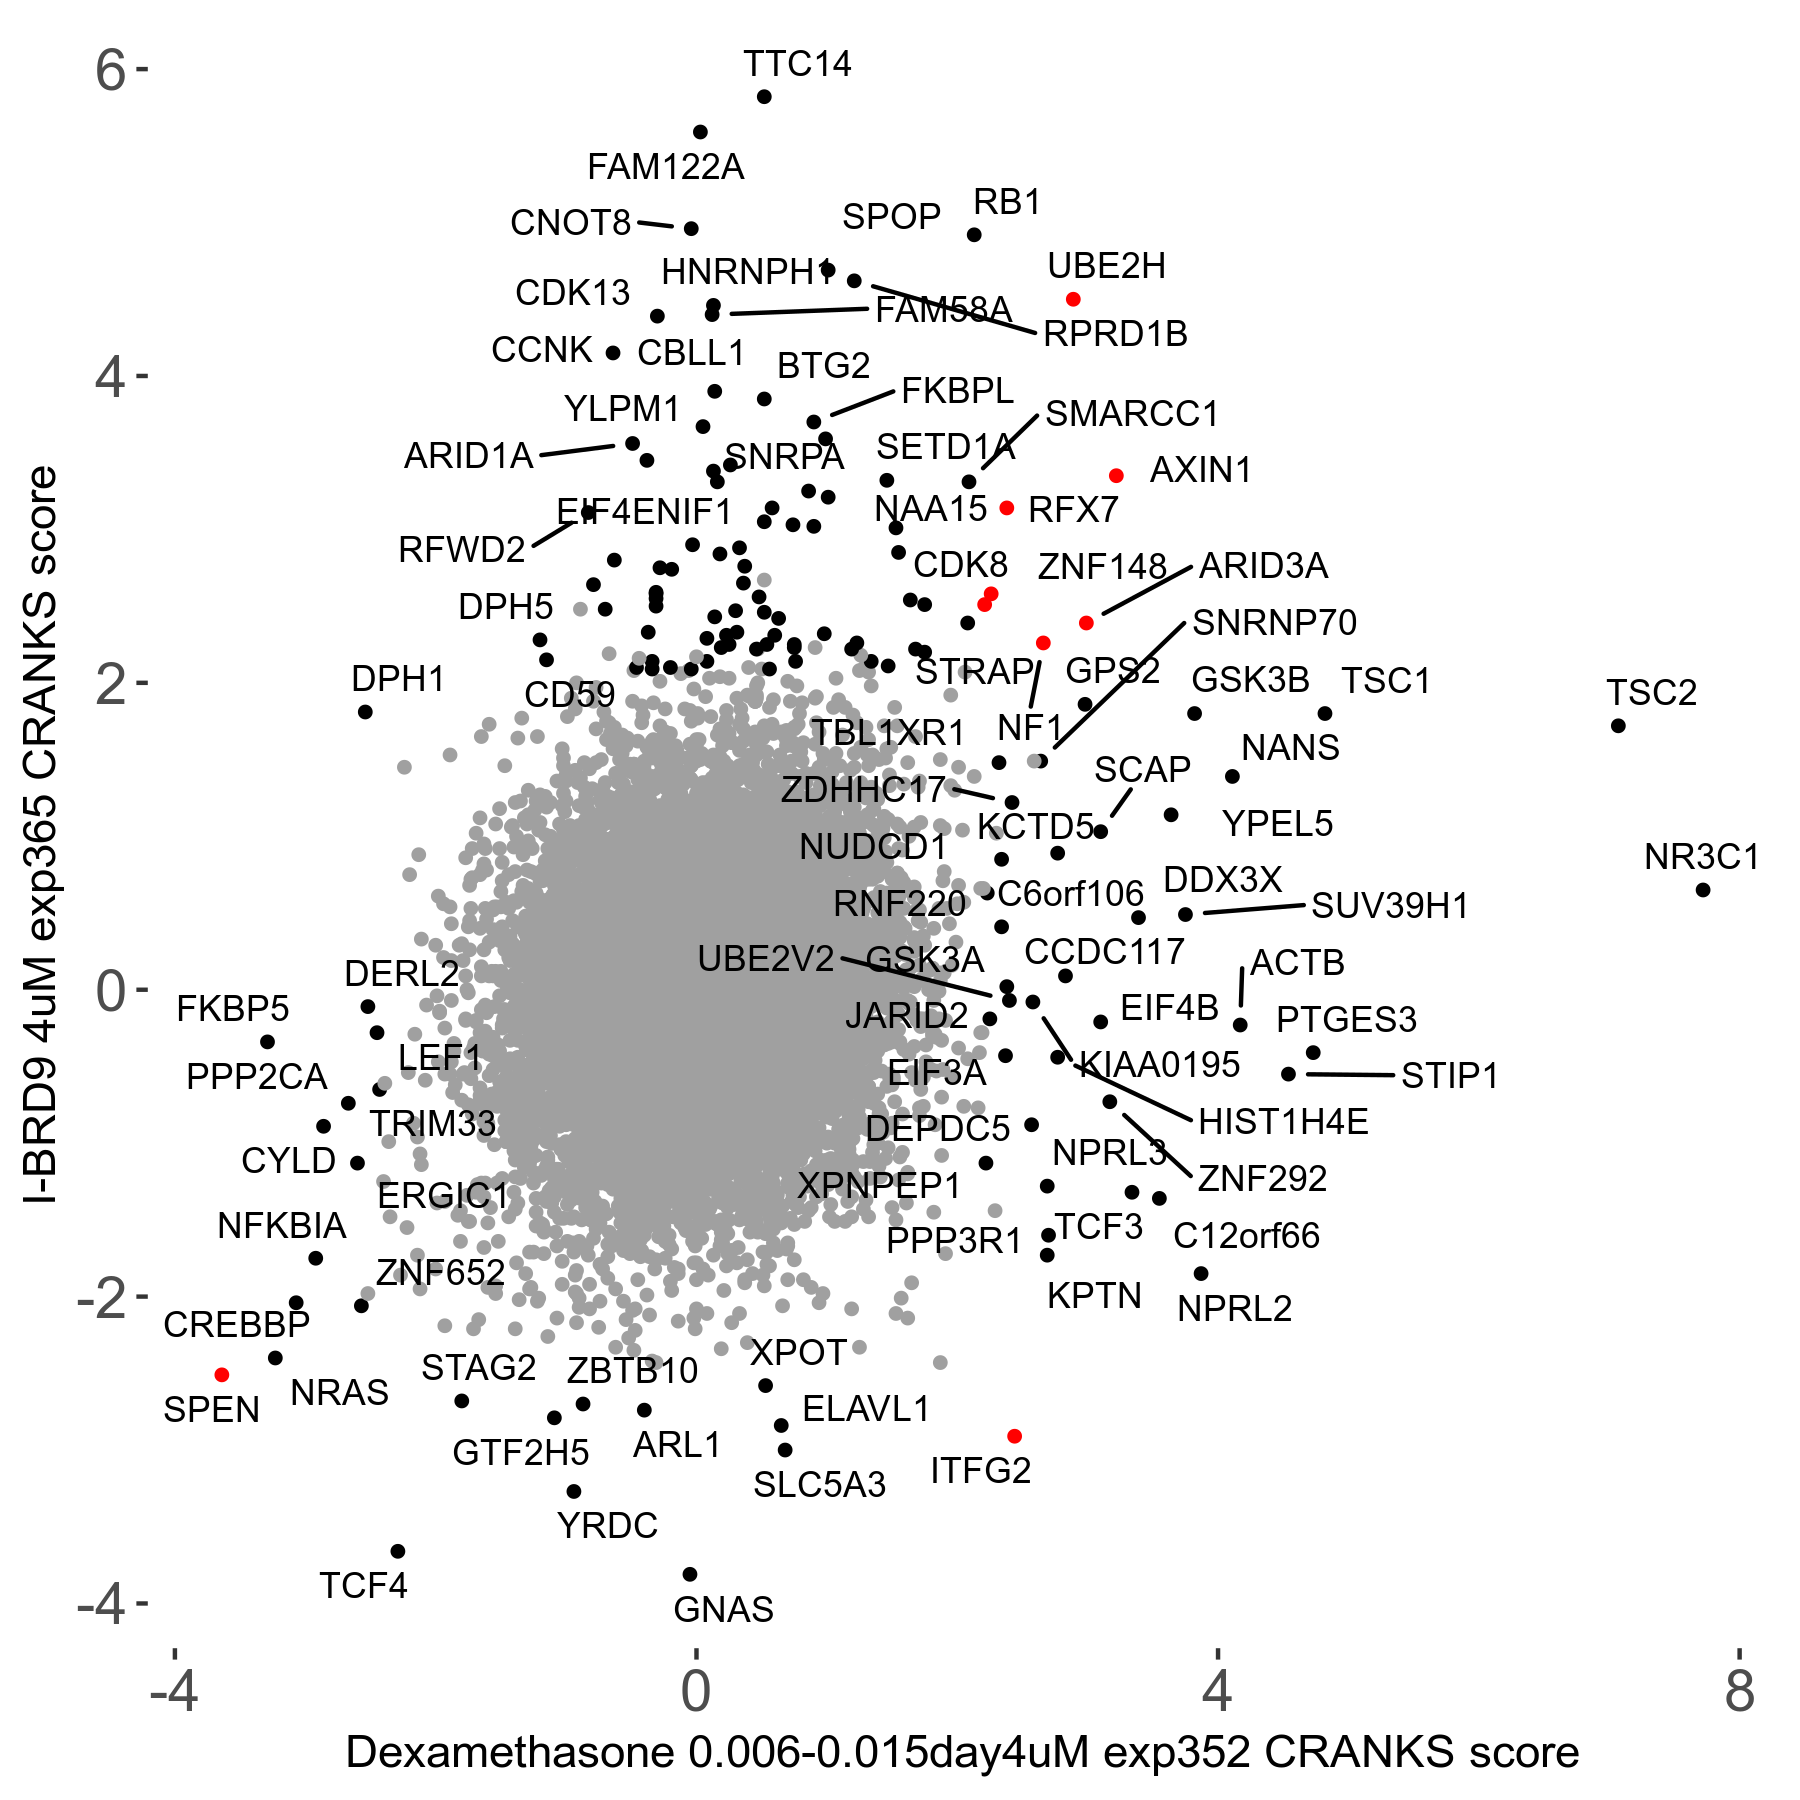
Dexamethasone 0.006 to 0.015μM on day4 R07 exp352 vs I-BRD9 4μM R07 exp365
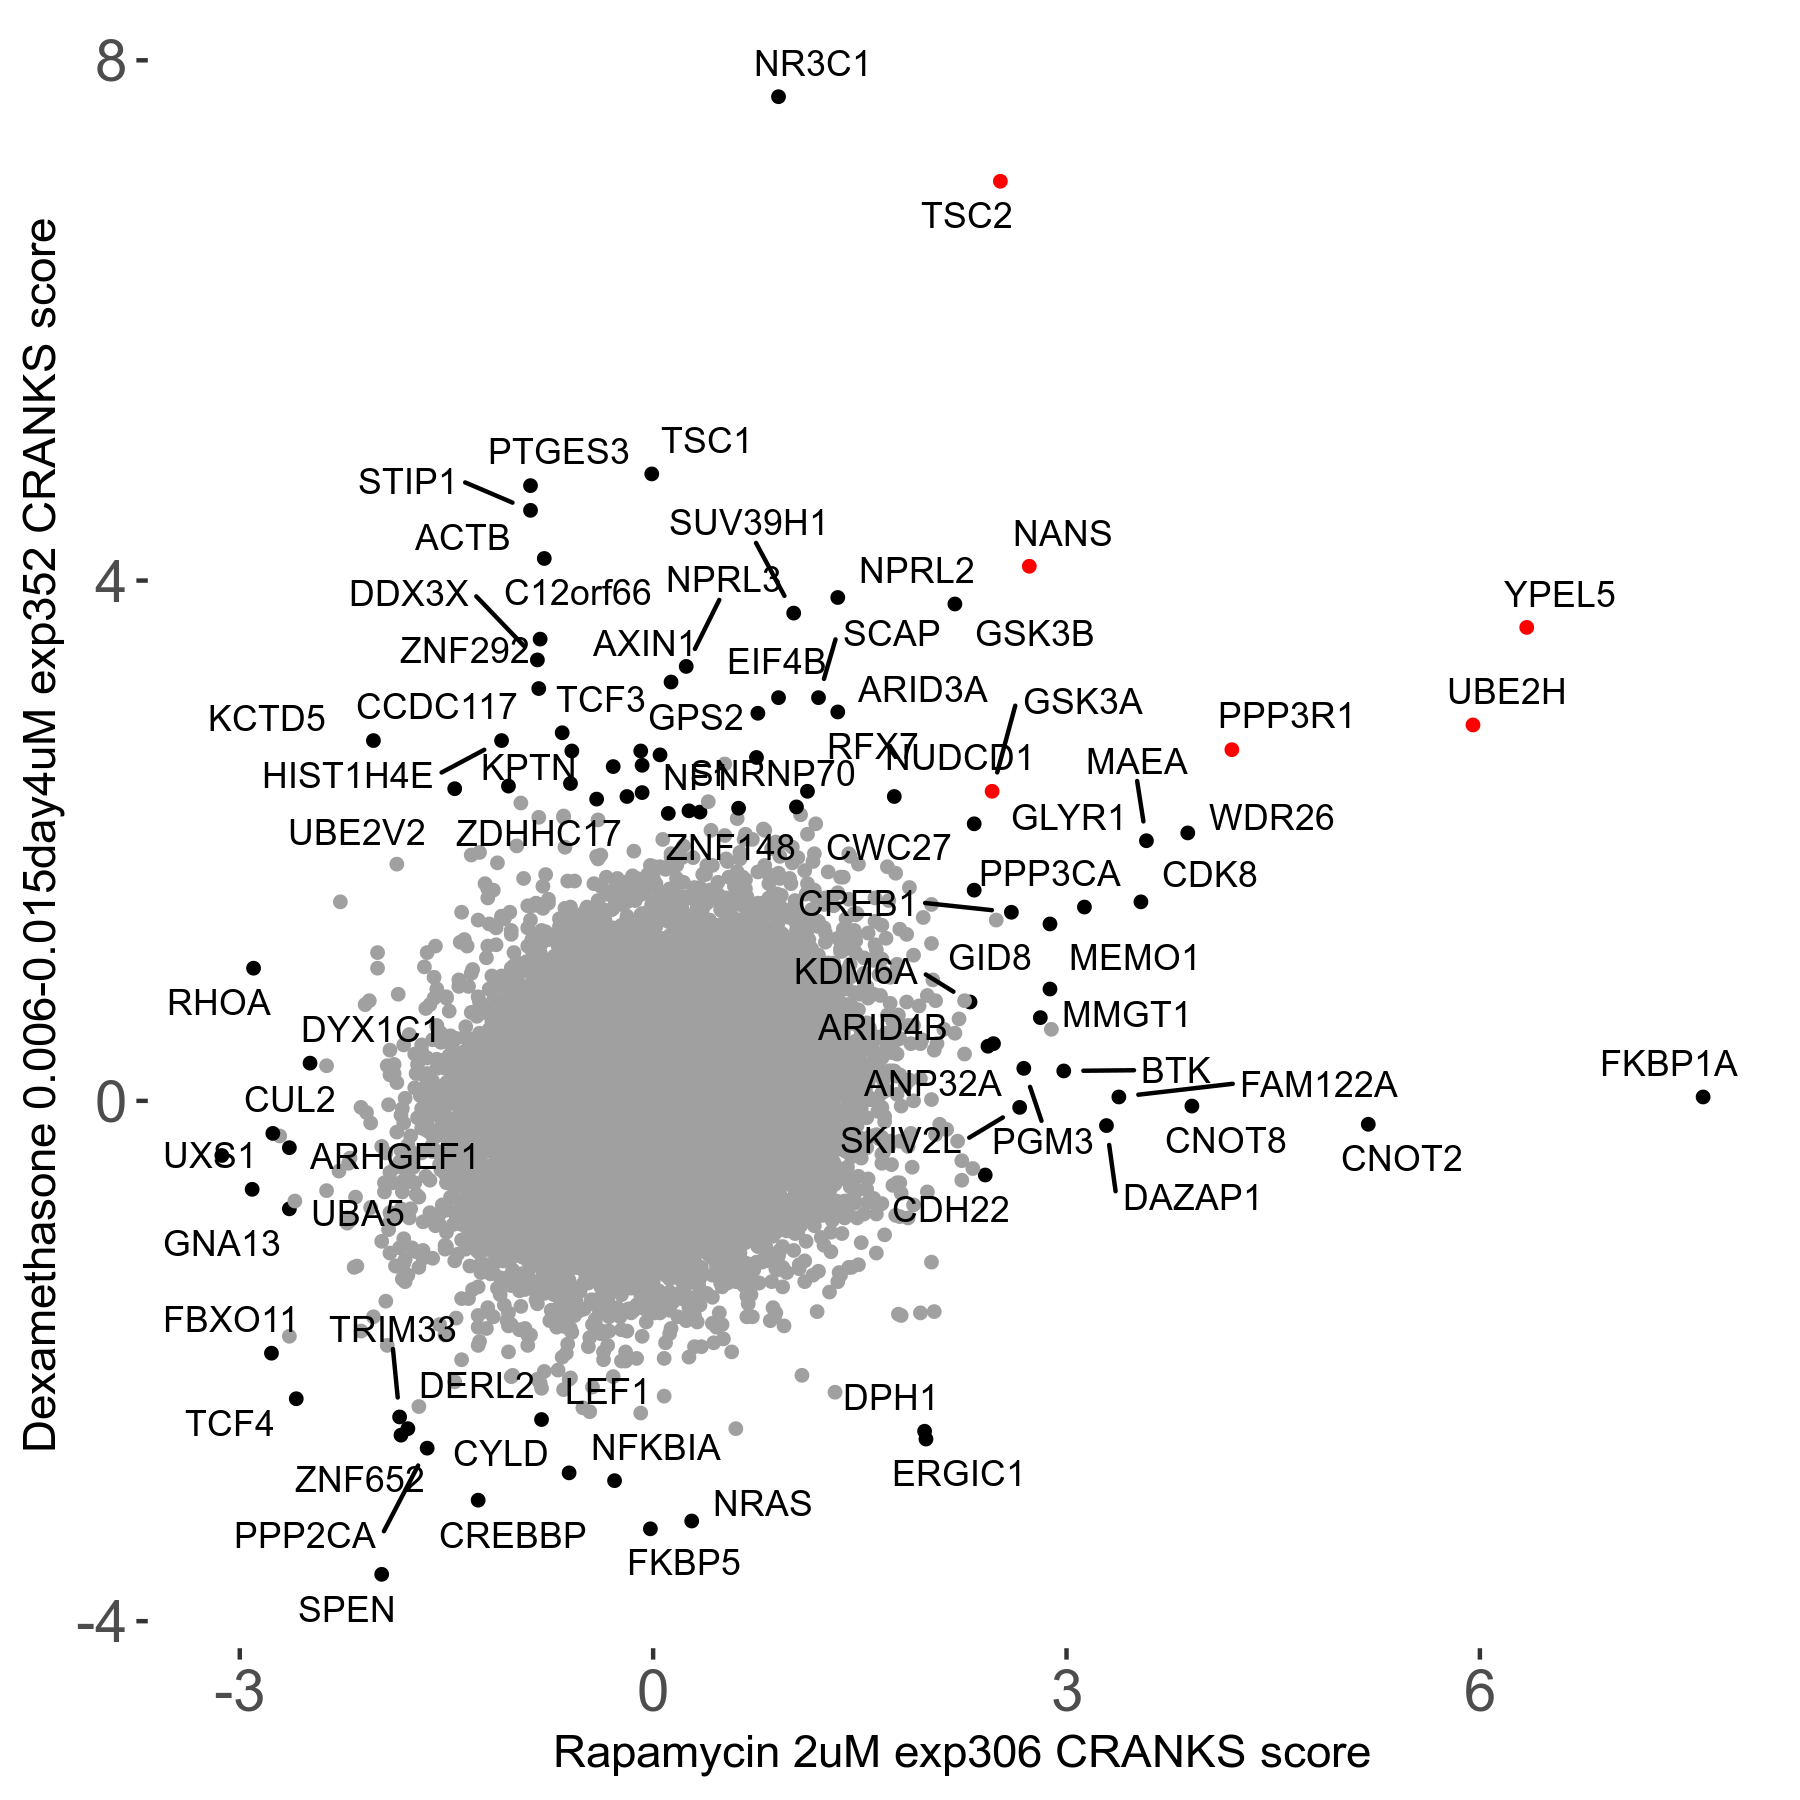
Dexamethasone 0.006 to 0.015μM on day4 R07 exp352 vs Rapamycin 2μM R07 exp306
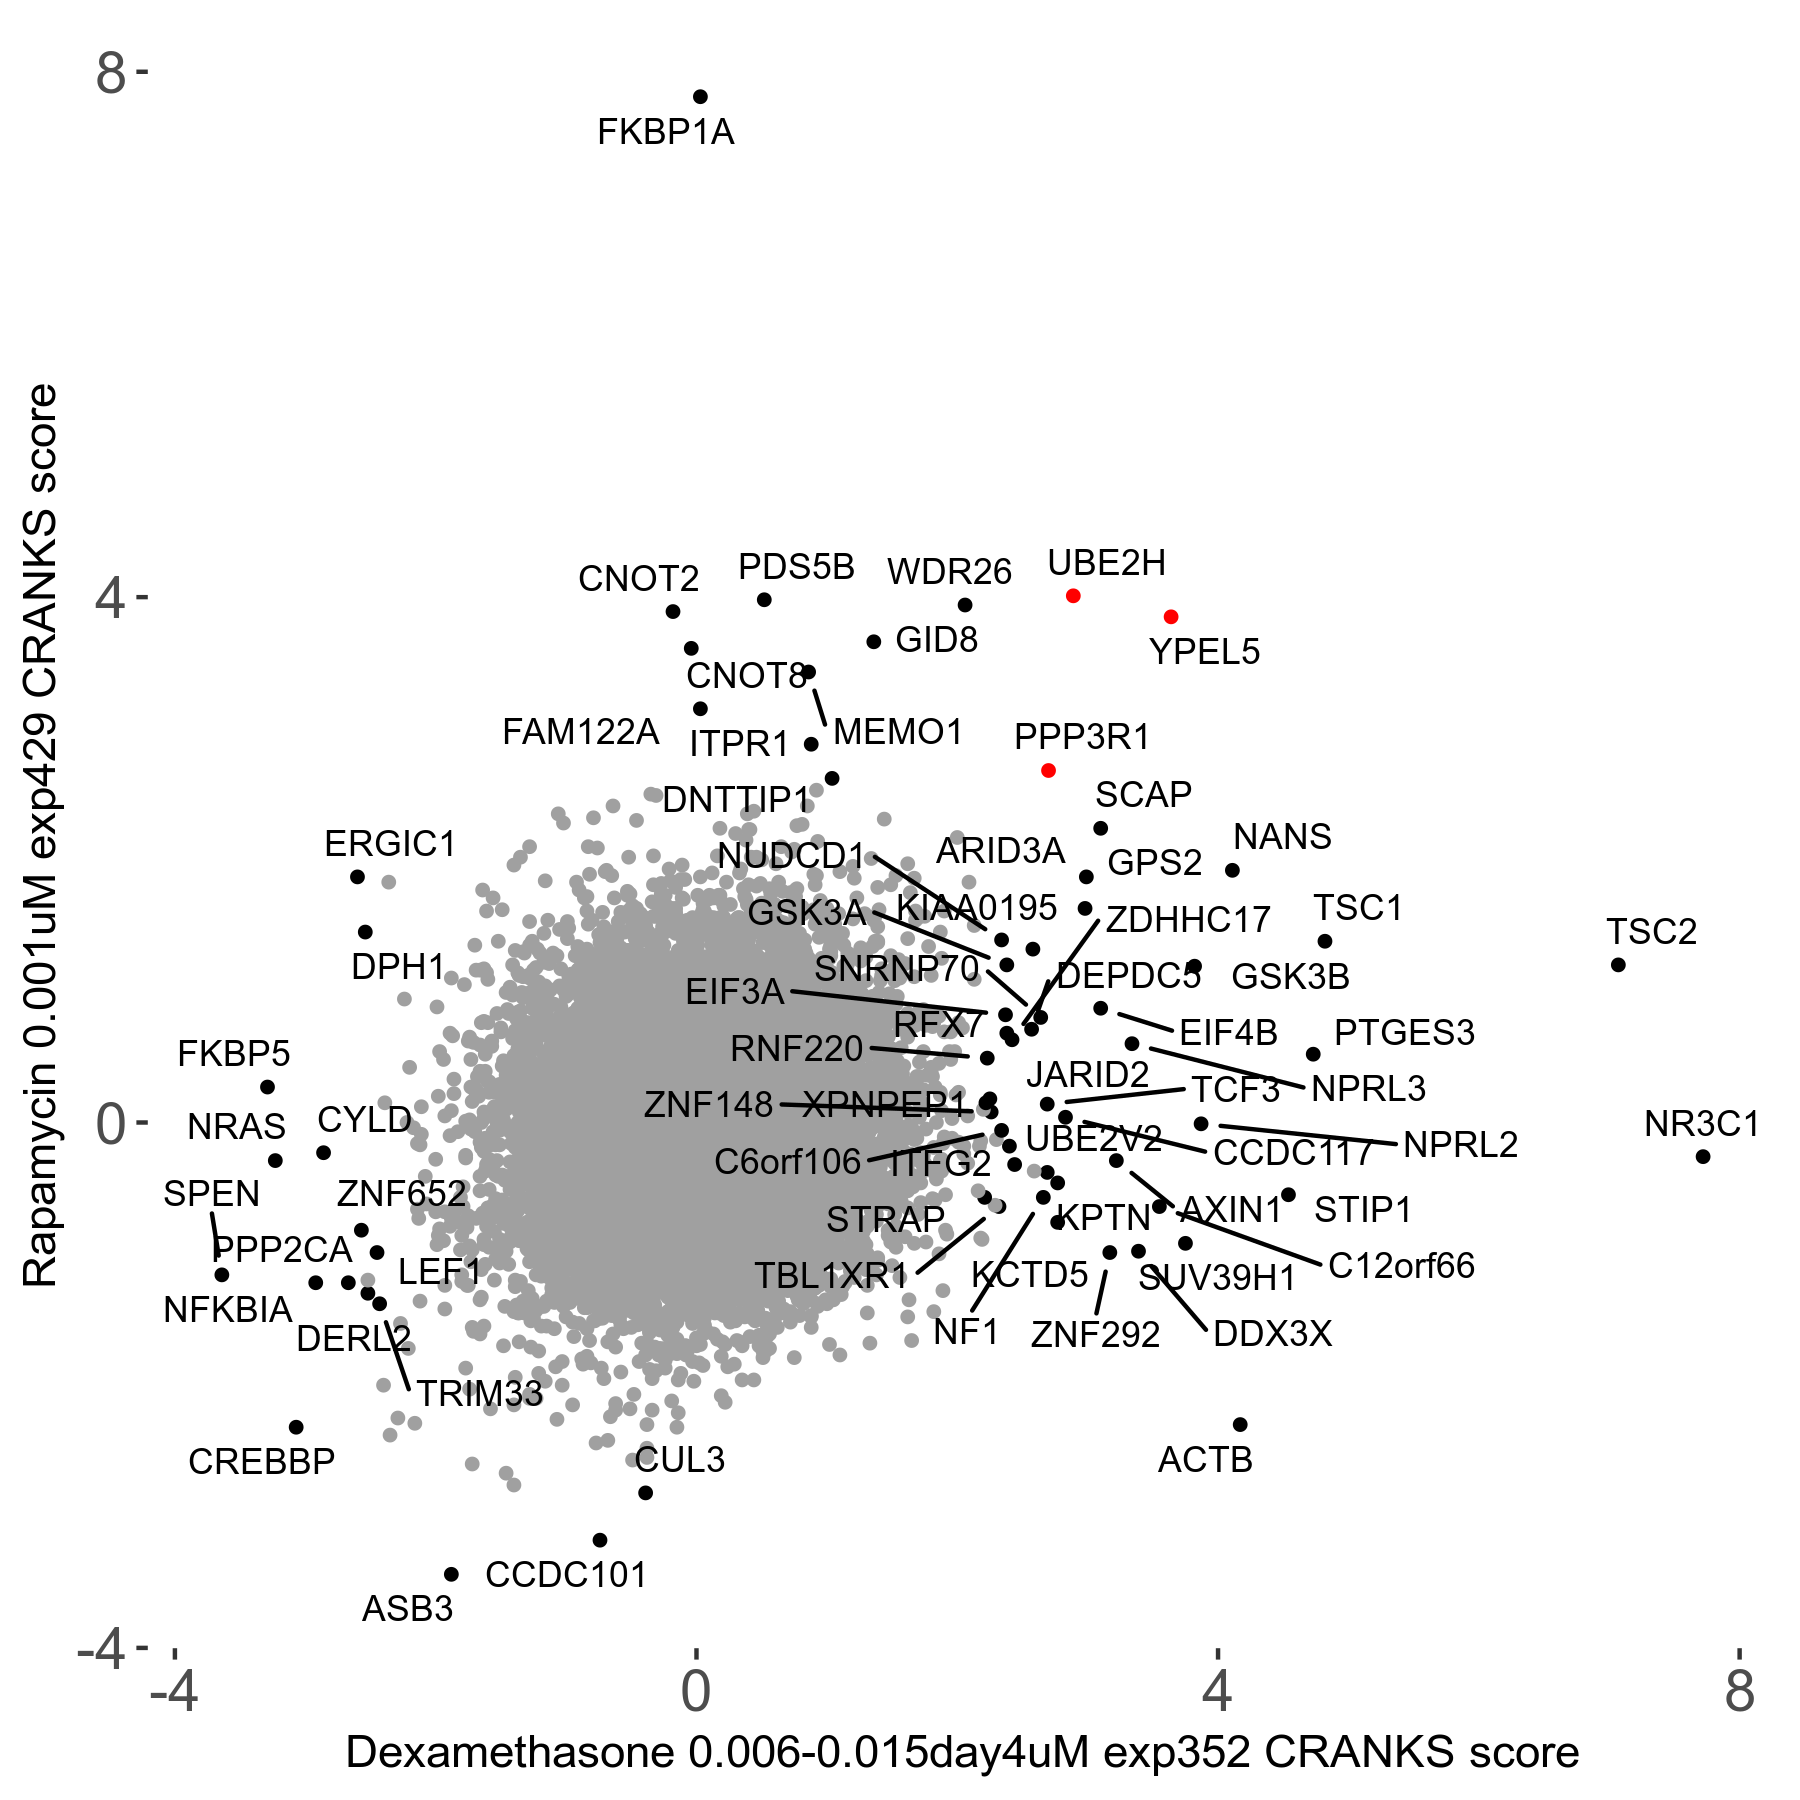
Dexamethasone 0.006 to 0.015μM on day4 R07 exp352 vs Rapamycin 0.001μM R08 exp429
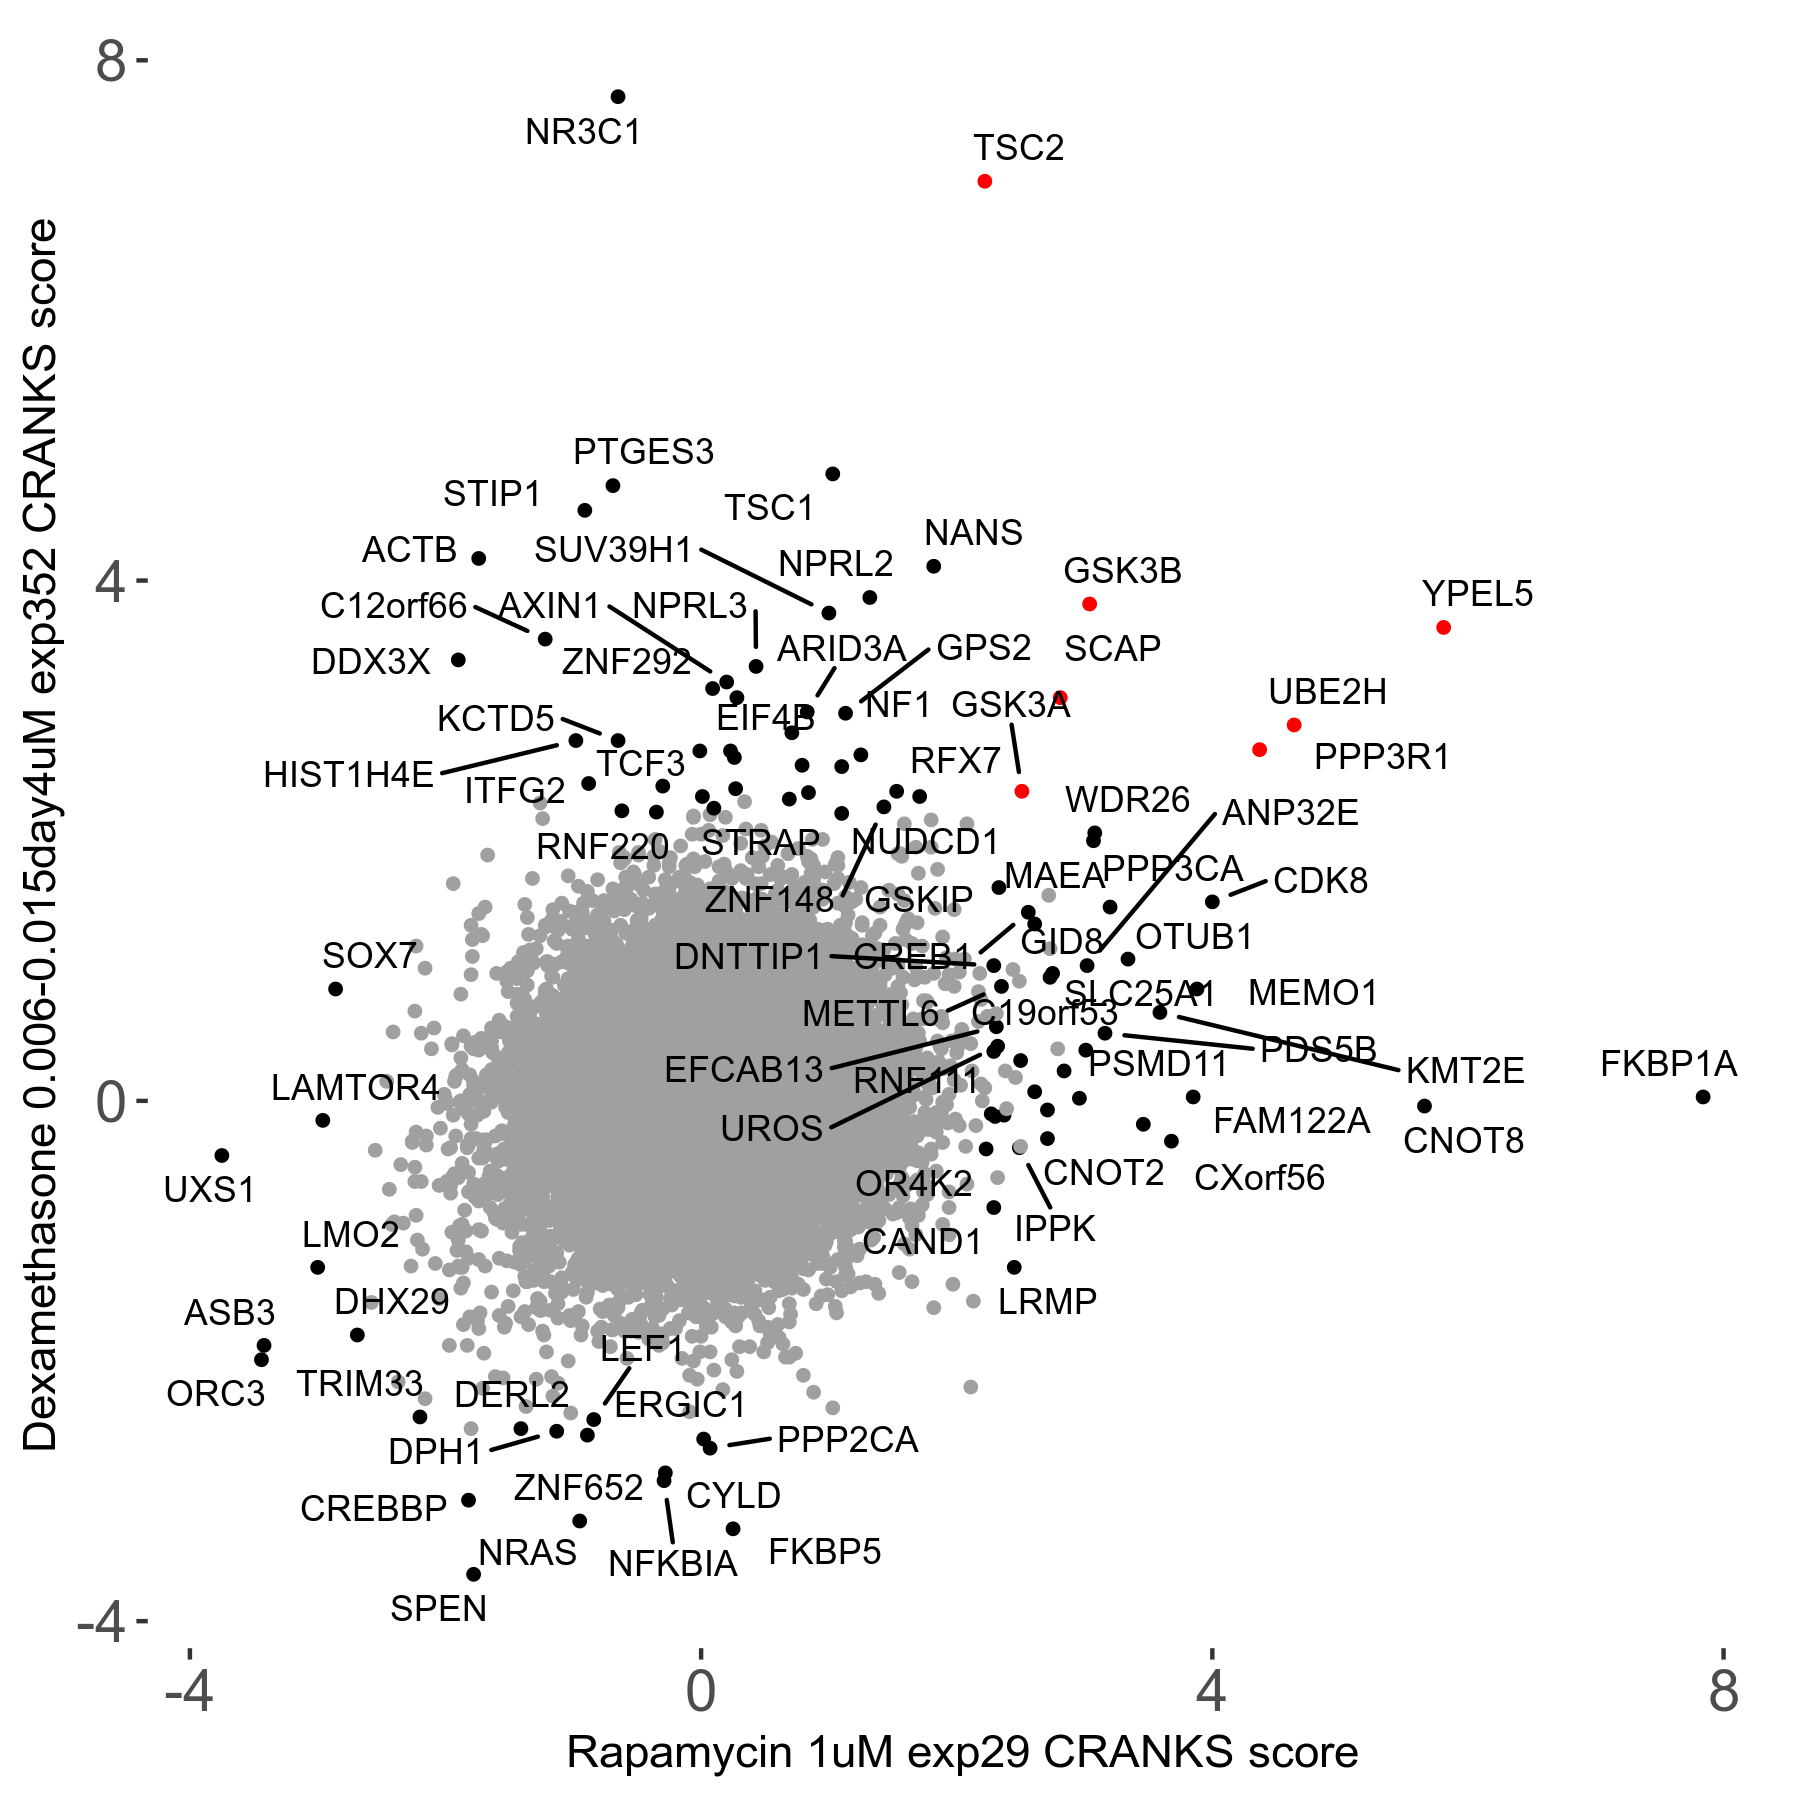
Dexamethasone 0.006 to 0.015μM on day4 R07 exp352 vs Rapamycin 1μM R00 exp29
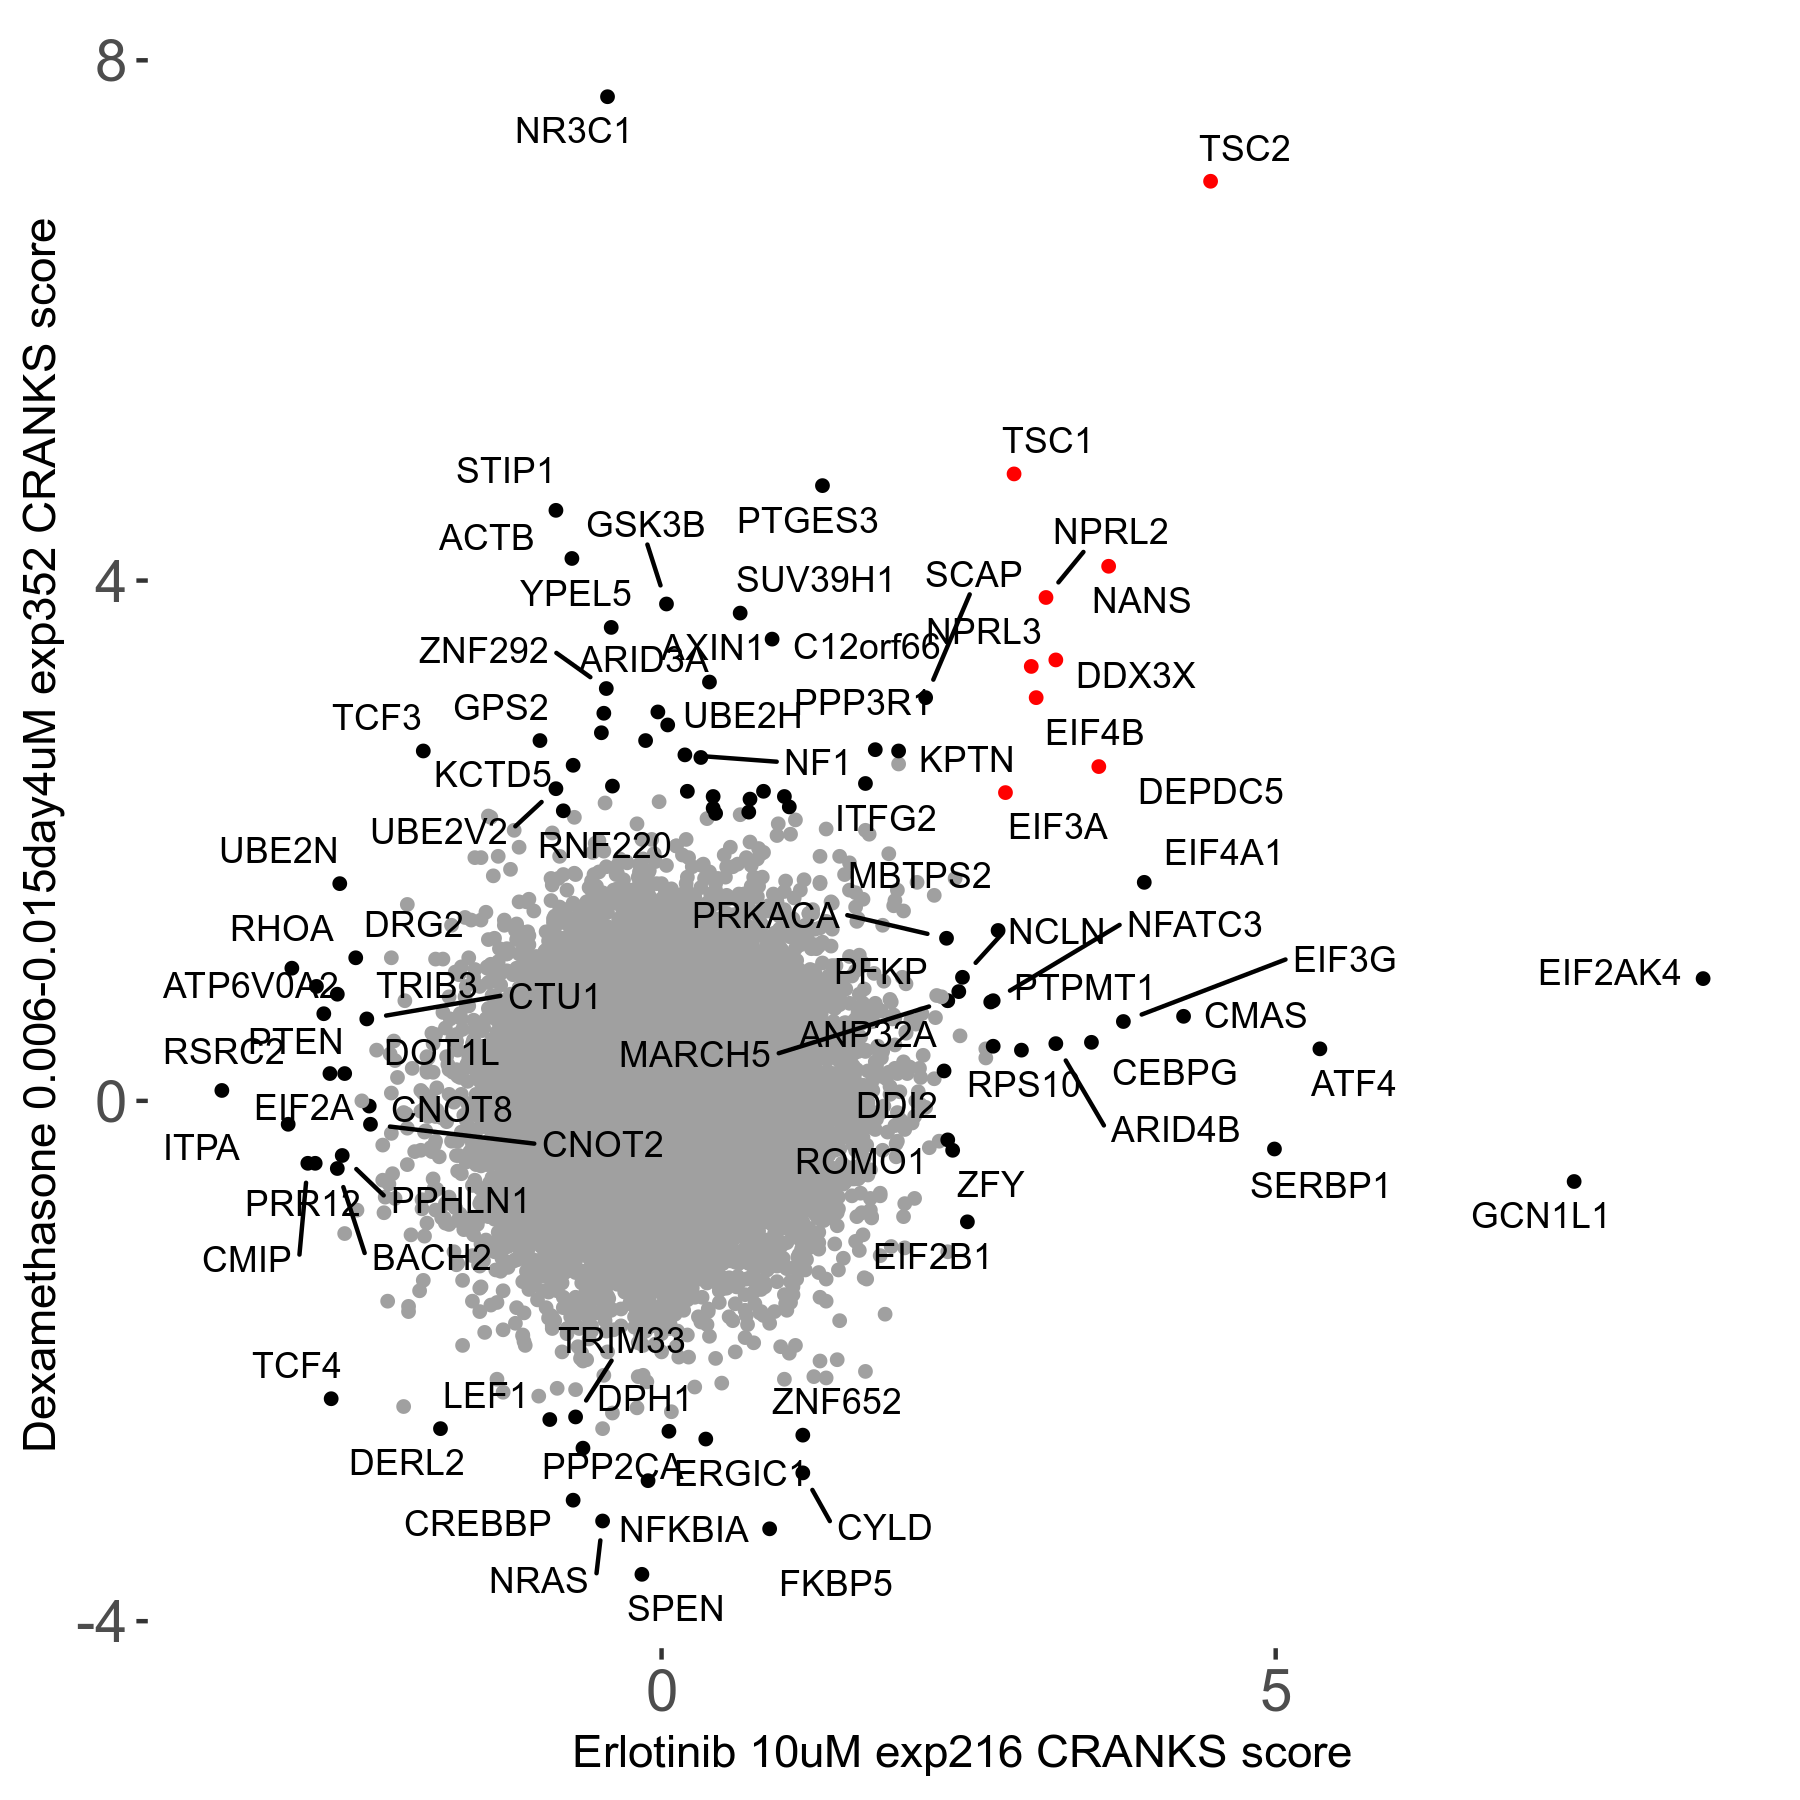
Dexamethasone 0.006 to 0.015μM on day4 R07 exp352 vs Erlotinib 10μM R05 exp216
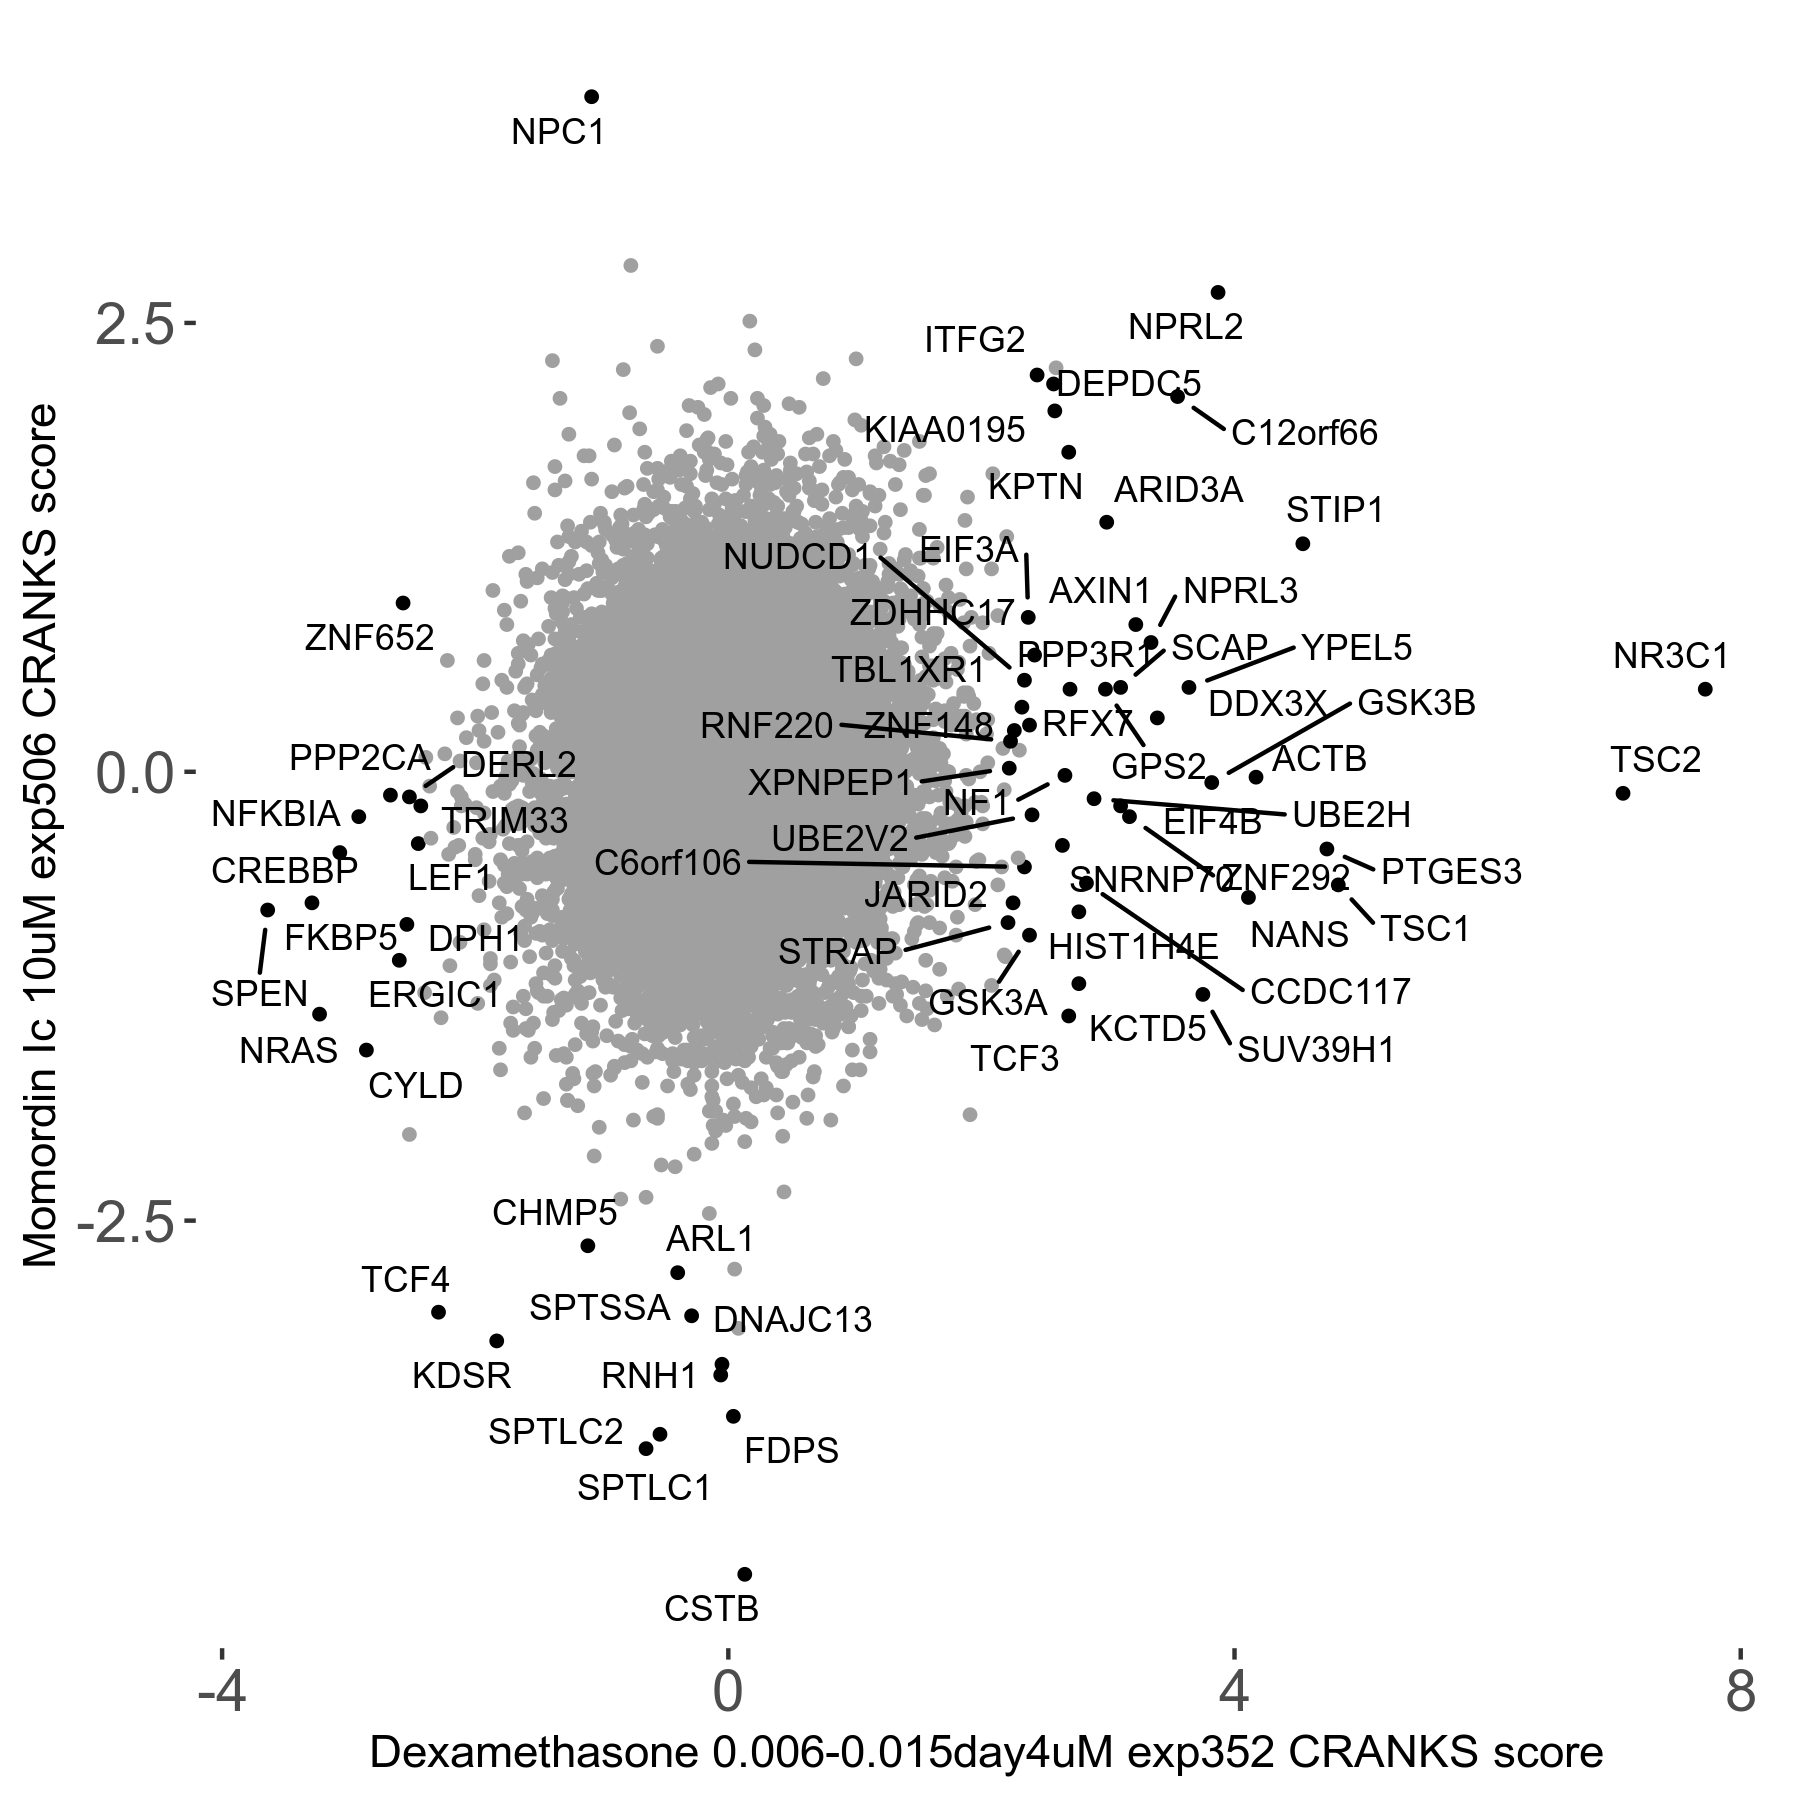
Dexamethasone 0.006 to 0.015μM on day4 R07 exp352 vs Momordin-Ic 10μM R08 exp506
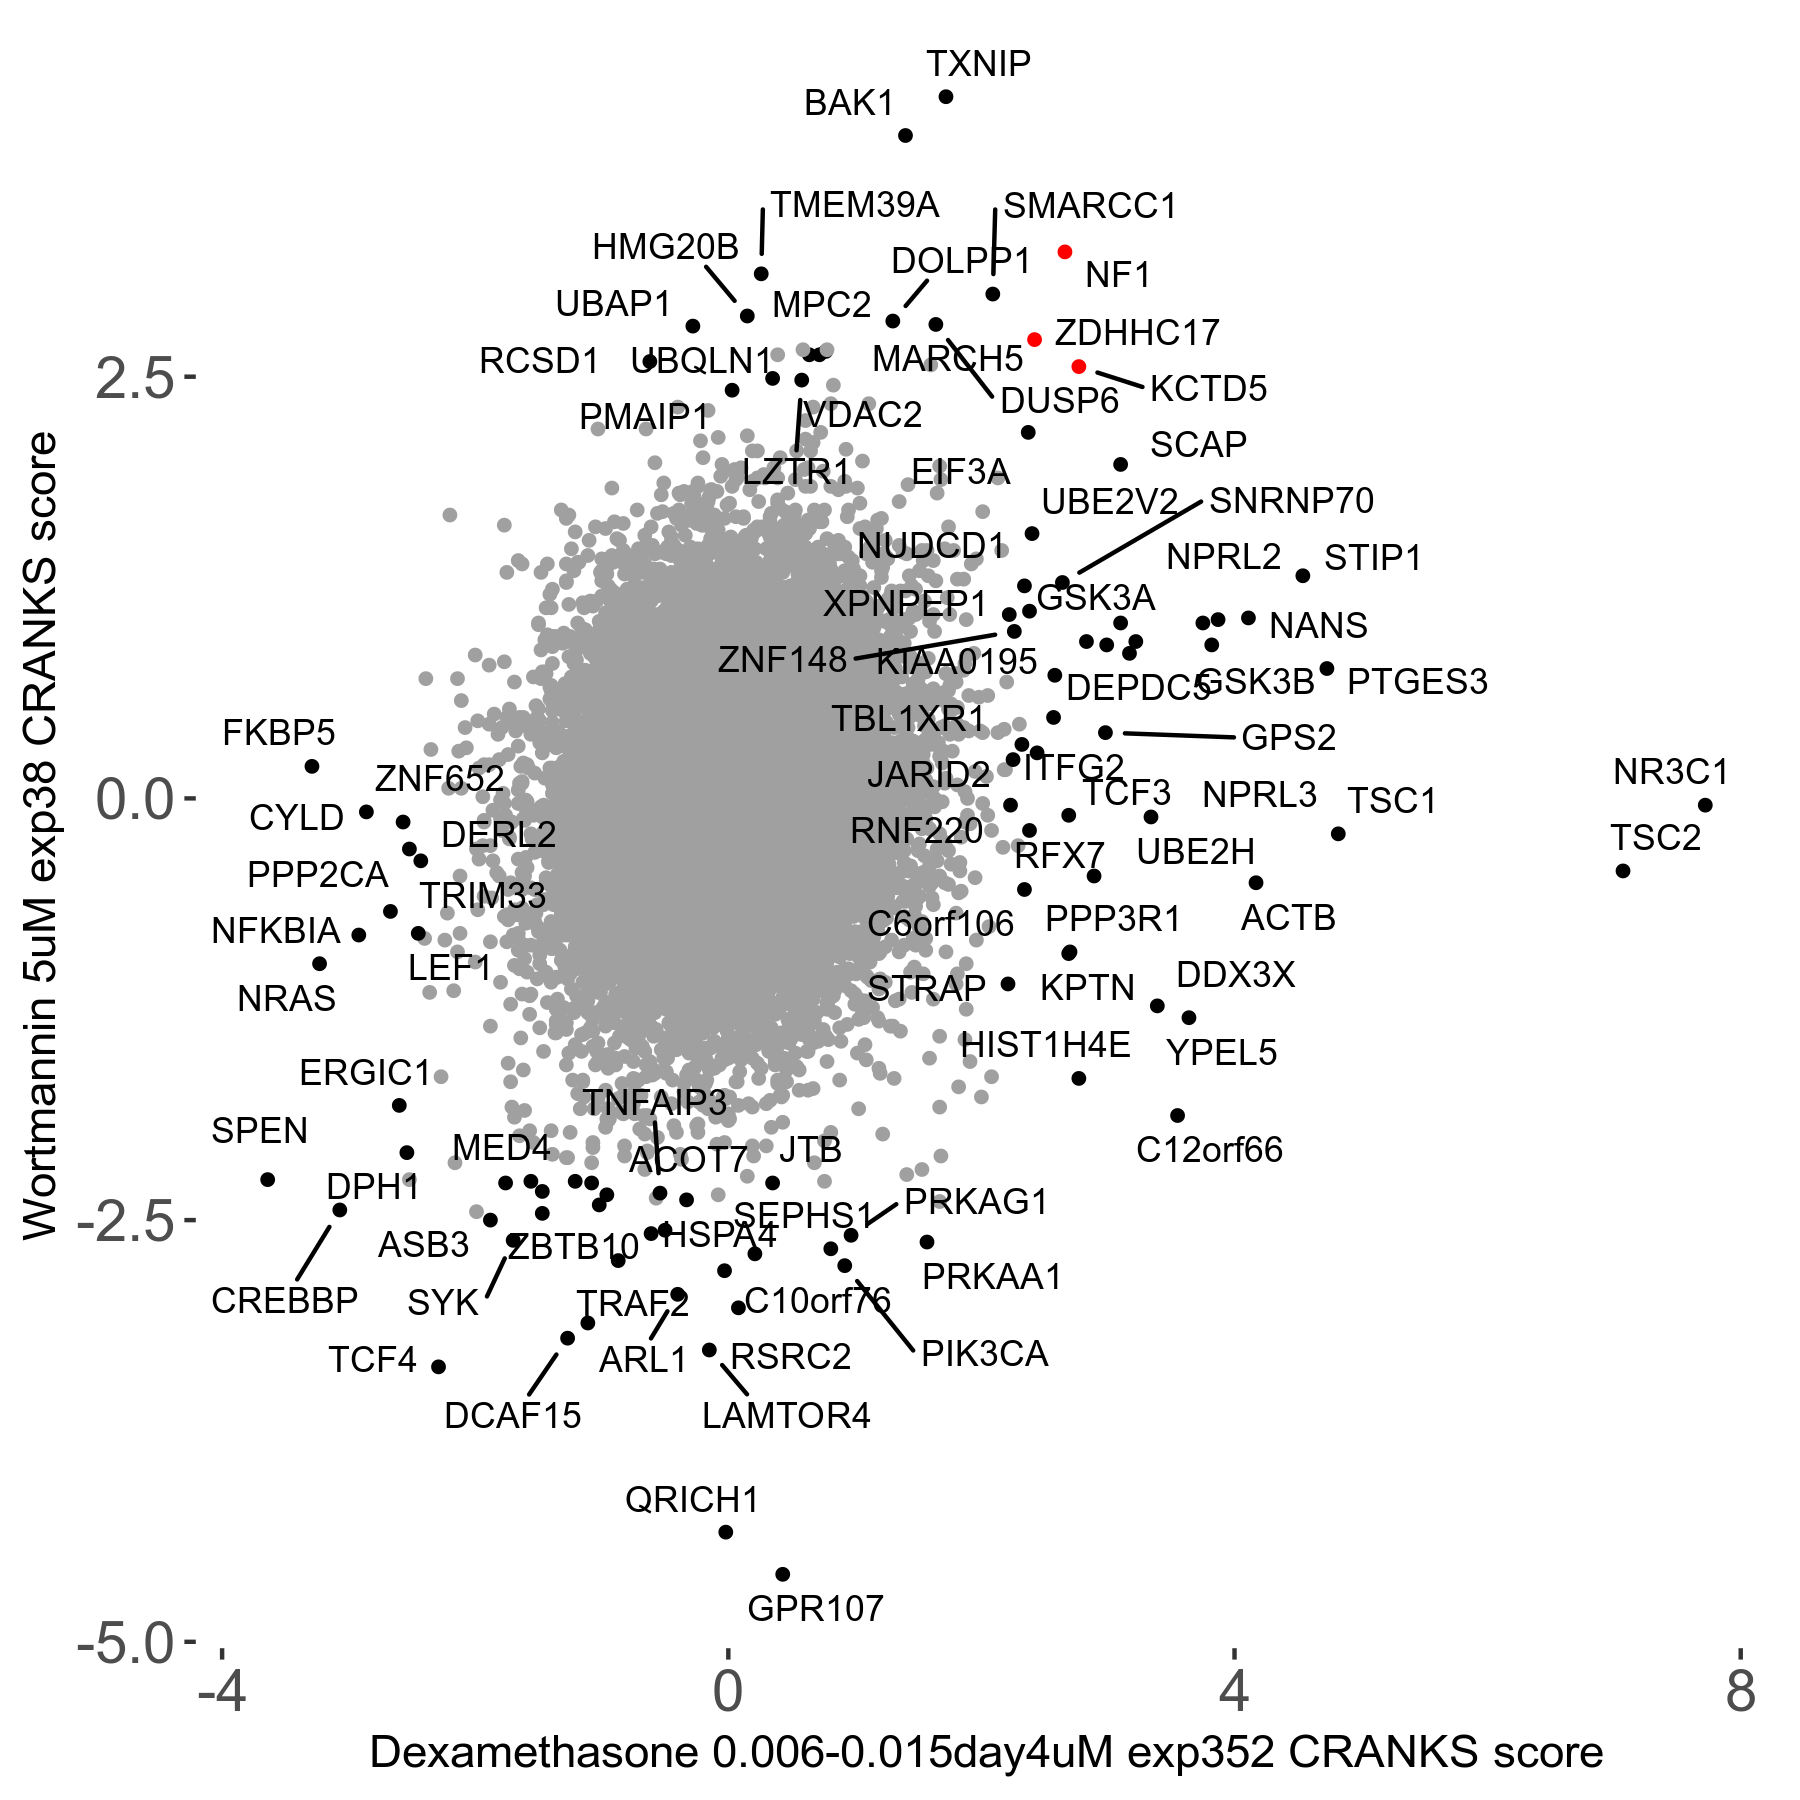
Dexamethasone 0.006 to 0.015μM on day4 R07 exp352 vs Wortmannin 5μM R00 exp38
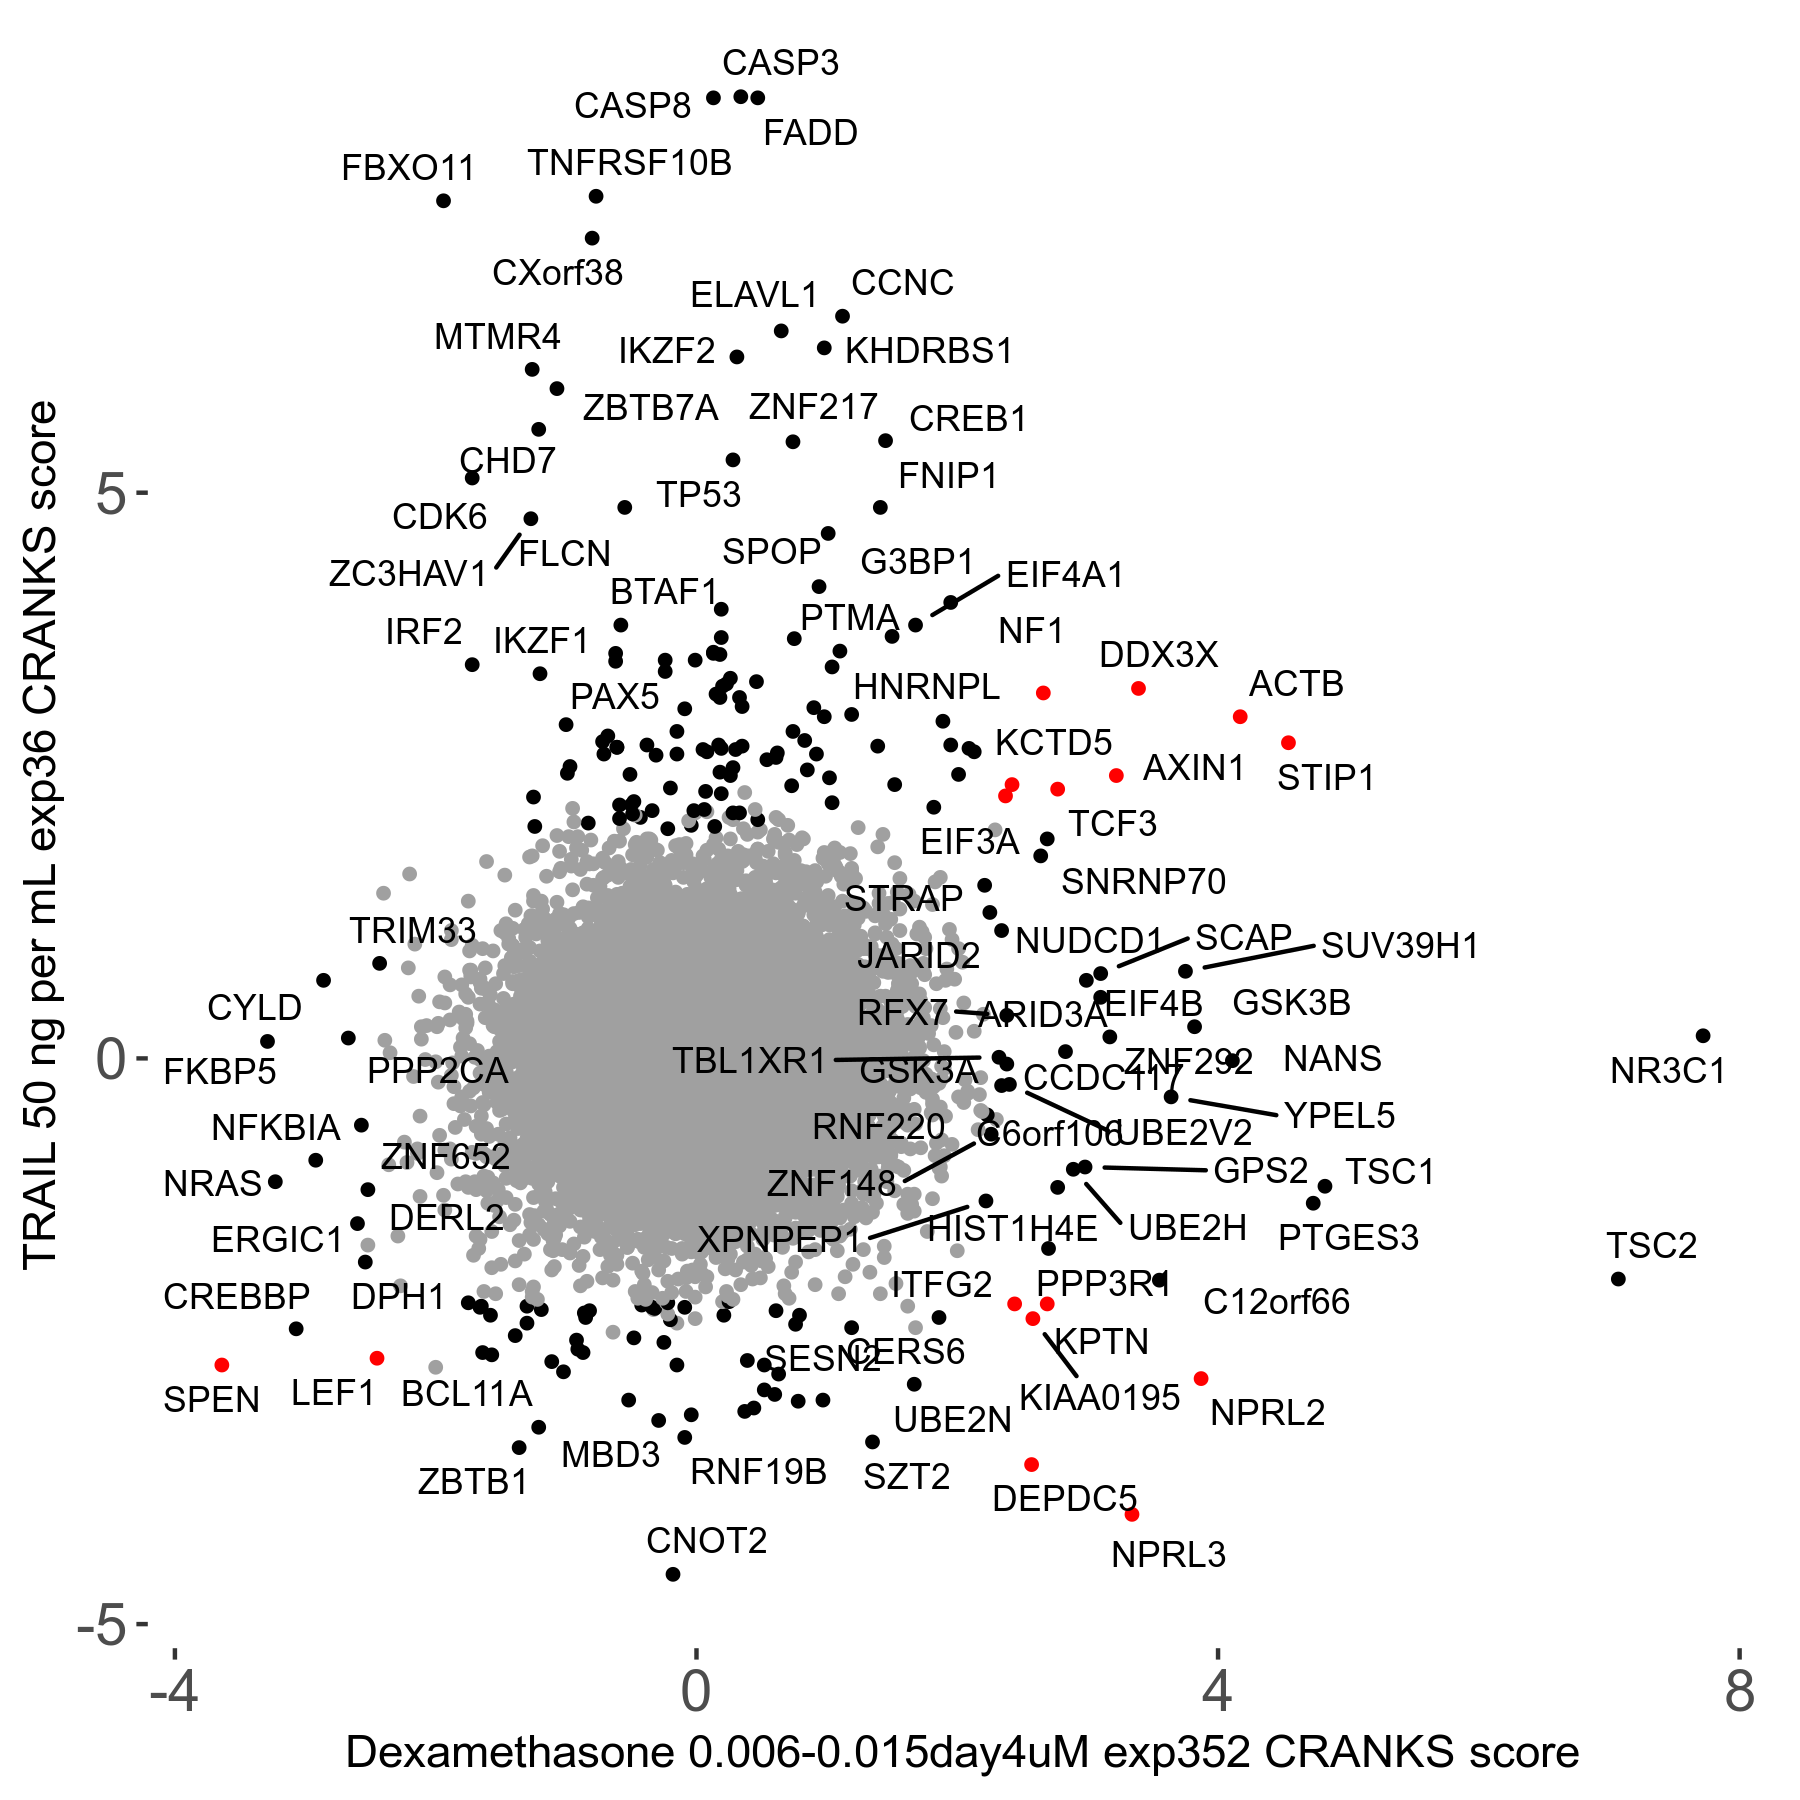
Dexamethasone 0.006 to 0.015μM on day4 R07 exp352 vs TRAIL 50ng/ml R00 exp36
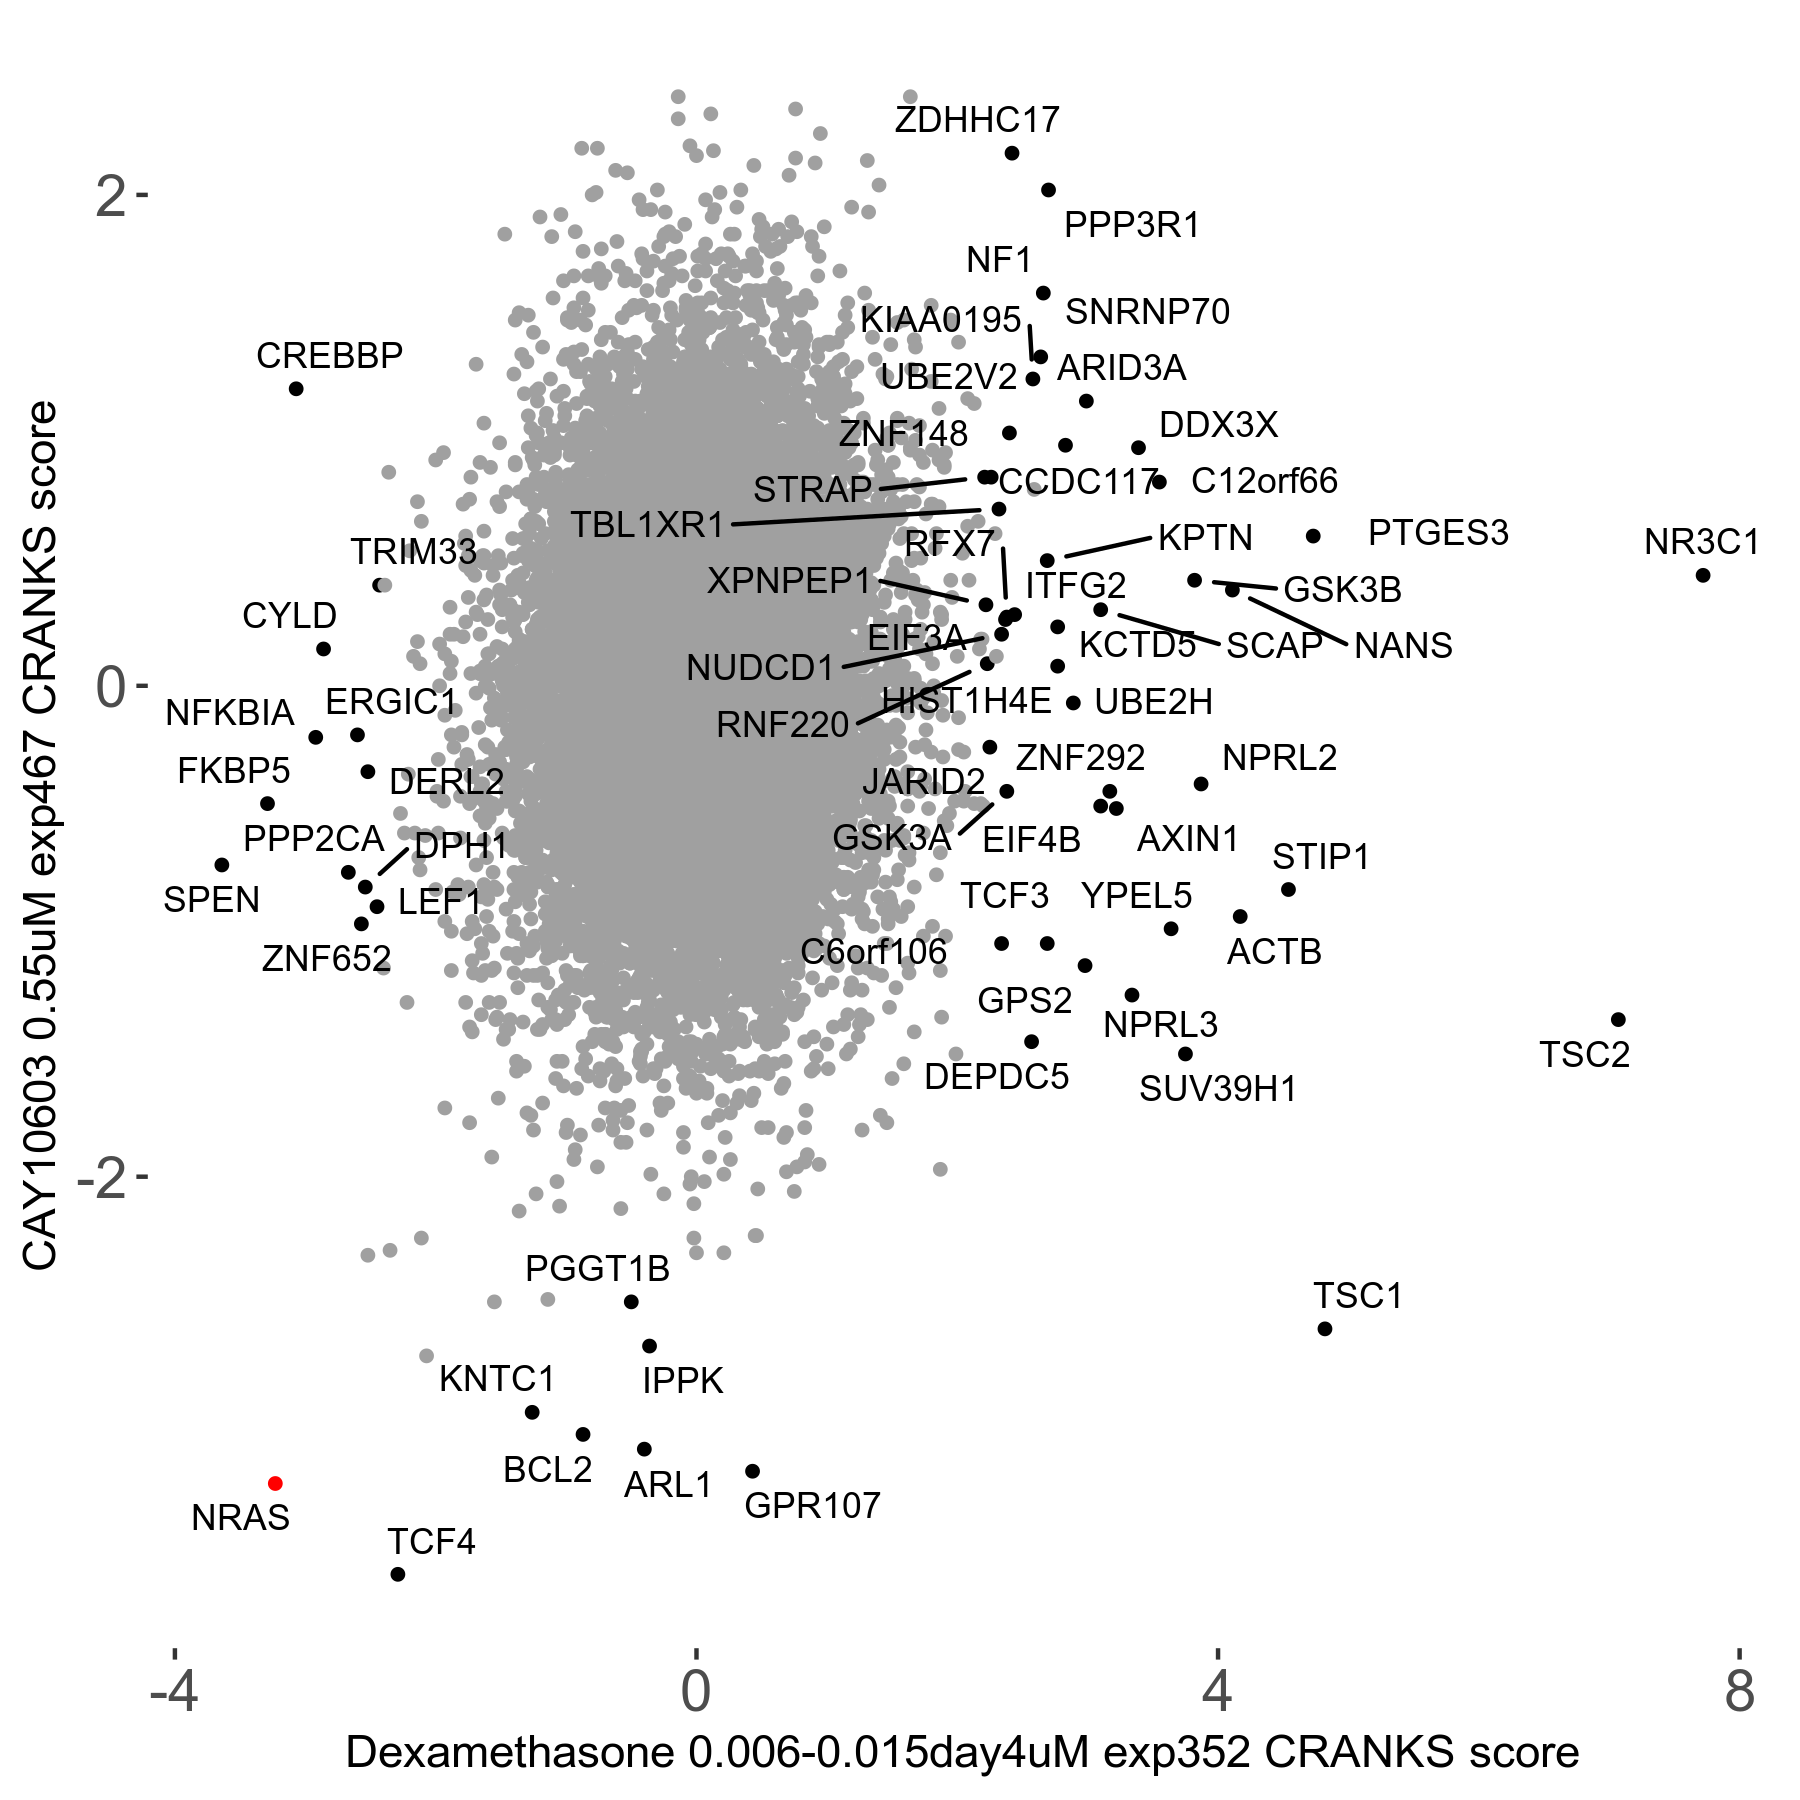
CAY10603 0.55μM R08 exp467 vs Dexamethasone 0.006 to 0.015μM on day4 R07 exp352